Fig. 3.

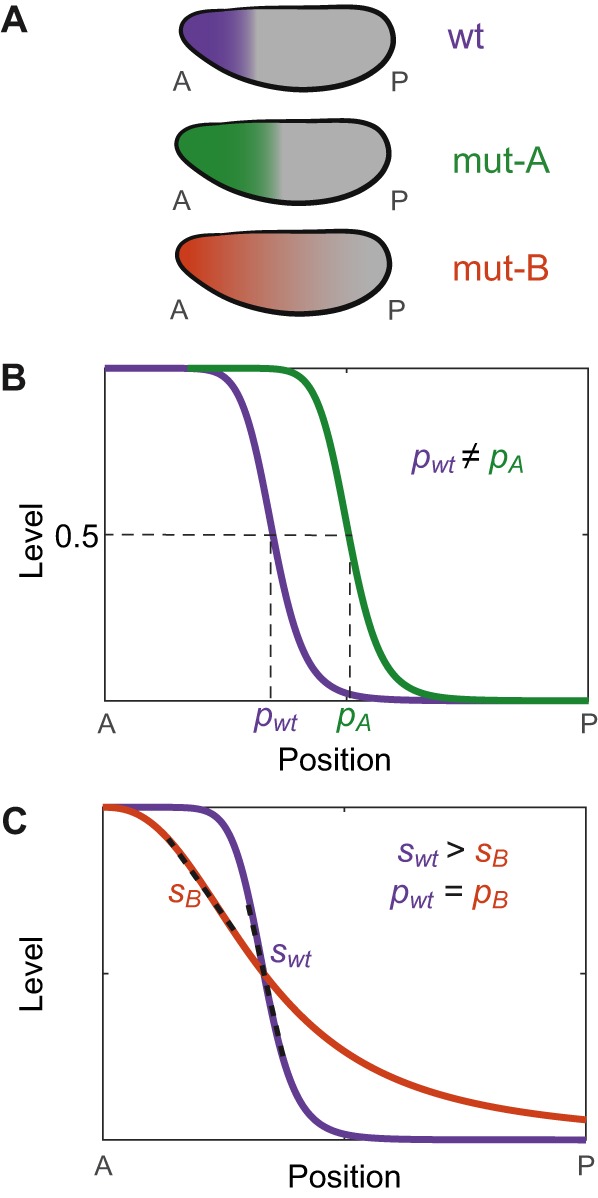
Precision and accuracy in the spatial location of transcription. (A) Examples of differences in the expression pattern of a gene between wild-type (wt) and perturbed/mutant (mut) early Drosophila embryos. (B) Accuracy in the spatial location of transcription can be assessed; for example, by comparing the expression pattern border position (pi), here determined by the half-maximum expression level along the AP axis. In mut-A, the border position is different from that of the wt and therefore lacks accuracy. (C) Precision in location can refer to reduced variation in expression levels near the expression pattern border, increasing the sharpness of the border. The maximum slope of the expression level versus position curve (i.e. the steepness, dashed lines) is a quantitative measurement of the sharpness of the expression pattern border. In mut-B, the steepness of the boundary (si) is less than that measured in the wt embryo. This leads to greater cell-to-cell variability in expression levels near the pattern border and a less precise or broader border region. In mut-B, as opposed to mut-A, the position of the expression pattern border, as defined above, is accurate.
