Fig. 3.
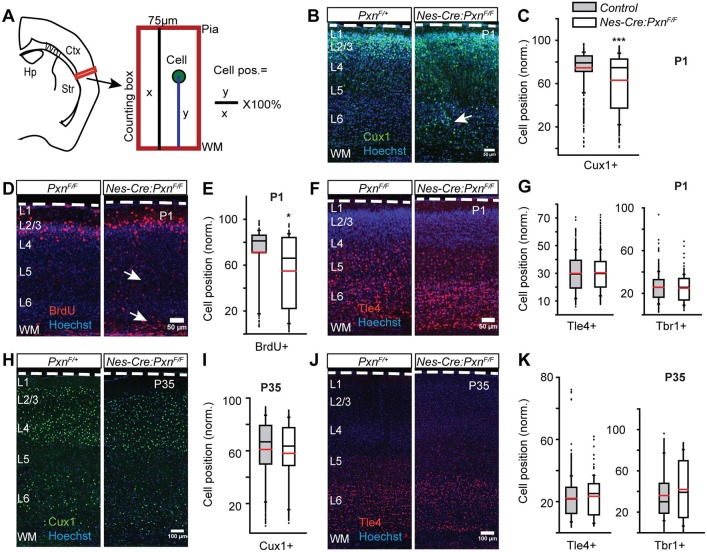
Neural precursor-specific deletion of paxillin delays upper layer neuronal positioning. (A) Schematic of neuronal positioning analyses within a defined area in lateral neocortex (box). Neuronal positions (y) were measured from the underlying white matter (WM), normalized to the total thickness of the cortical wall (x), and expressed as a percentage. (B-G) Neuronal position at P1. (B) Representative images of P1 littermate controls (PxnF/+) and mutants (Nes-Cre:PxnF/F) immunostained for Cux1 (green). More Cux1+ neurons were found in ectopic deep positions (arrow) in the mutant cortex compared with littermate controls. (C) Box-and-whisker plot showing a broad distribution of Cux1+ neurons in the mutant cortices. The mean position of Cux1+ neurons was significantly deeper in the mutant cortex [n=7 for control (4 Pxn F/+ and 3 Nes-Cre;PxnF/+) and n=5 for Nes-Cre;PxnF/F]. (D) Representative images of BrdU+ (injected at E15.5) neurons (red) at P1 showing ectopic BrdU+ cells in the deep cortex (arrows). (E) Box-and-whisker plot showing the distribution of BrdU+ neurons in the mutant cortices. The mean position of BrdU+ neurons was significantly deeper in the mutant cortex [n=3 for PxnF/F (control) and n=4 for Nes-Cre;PxnF/F (mutant)]. (F) Representative images of Tle4+ neurons (red) at P1. (G) Box-and-whisker plot distribution of Tle4+ neurons and Tbr1+ neurons. There was no difference in the mean position of Tle4+ [n=3 for PxnF/F (control) and n=4 for Nes-Cre;PxnF/F (mutant)] neurons and no difference between Tbr1+ [n=4 Pxn F/+, n=3 Nes-Cre;PxnF/+ (controls) and n=5 for Nes-Cre;PxnF/F (mutant)] neurons. (H-K) Neuronal position analysis in P35 cortex. (H) Representative images of P35 littermate control (PxnF/+) and mutant (Nes-Cre:PxnF/F) neurons immunostained for Cux1 (green). (I) Distribution of Cux1+ neurons. No difference in the mean position of Cux1+ neurons was detected between genotypes [n=7 for control (n=4 PxnF/+ and n=3 Nes-Cre;PxnF/+) and n=4 for Nes-Cre;PxnF/F(mutant)]. (J) Representative image of Tle4+ (red) neurons at P35. (K) Distribution of Tle4+ and Tbr1+ neurons. No difference in the mean position of either Tle4+ [n=9 in control (n=5 PxnF/+ and n=4 Nes-Cre;PxnF/+), n=5 in Nes-Cre;PxnF/F (mutant)] or Tbr1+ [n=6 in control (n=3 PxnF/+ and n=3 Nes-Cre;PxnF/+), n=4 in Nes-Cre;PxnF/F (mutant)] neurons was detected between genotypes. Dashed white lines outline the pial surface. Data were analyzed using unpaired Student's t-test. *P<0.05, ***P<0.001. Scale bars: 50 µm in B,D,F; 100 µm in H,J.

