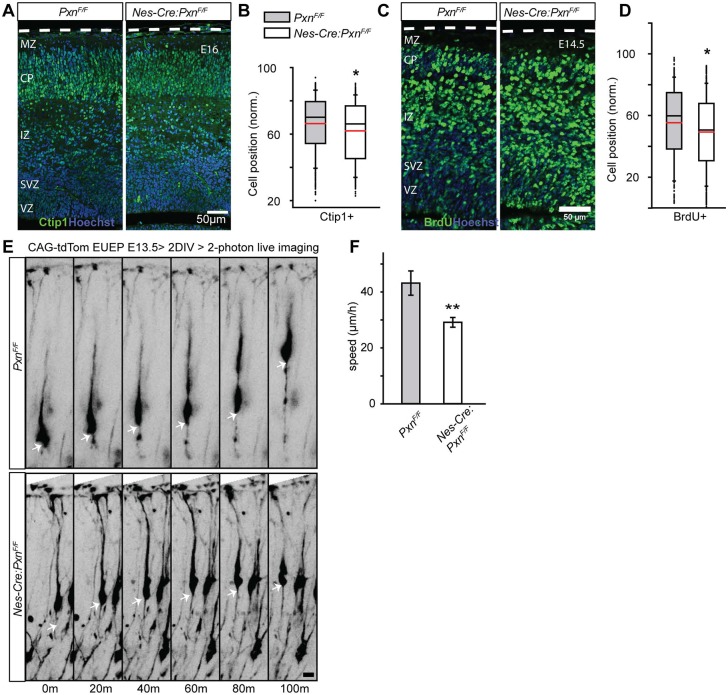
Fig. 8.
Paxillin-deficient mutant neurons migrate slowly. (A) Representative images of littermate control and Nes-Cre:PxnF/F paxillin-deficient cortical sections immunostained for Ctip1 (green) at E16. (B) Box-and-whisker plot distribution of Ctip1+ neurons. The mean position of Ctip1+ neurons was 4.5% deeper in the paxillin mutant (n=3/group). (C) Representative images of BrdU+ (injected at E12.5) neurons (red) at E14.5 showing ectopic BrdU positioning in the deep cortex. (D) Box-and-whisker plot showing a broad distribution of BrdU+ neurons in the mutant cortices. The mean position of BrdU+ neurons was significantly deeper in the mutant cortex (n=4 in PxnF/F, n=5 in Nes-Cre:PxnF/F). (E) Multiphoton images GFP-labeled neurons in whole hemisphere explants from PxnF/F (control) and Nes-Cre:PxnF/F (mutant) embryos. Arrows show the position of a single neuronal soma over time. (F) Quantification of speed of migrating neurons (n=12 cells per group from three mutant and three control explants). *P<0.05, **P<0.01. Scale bars: 50 µm in A,C; 10 µm in E.

