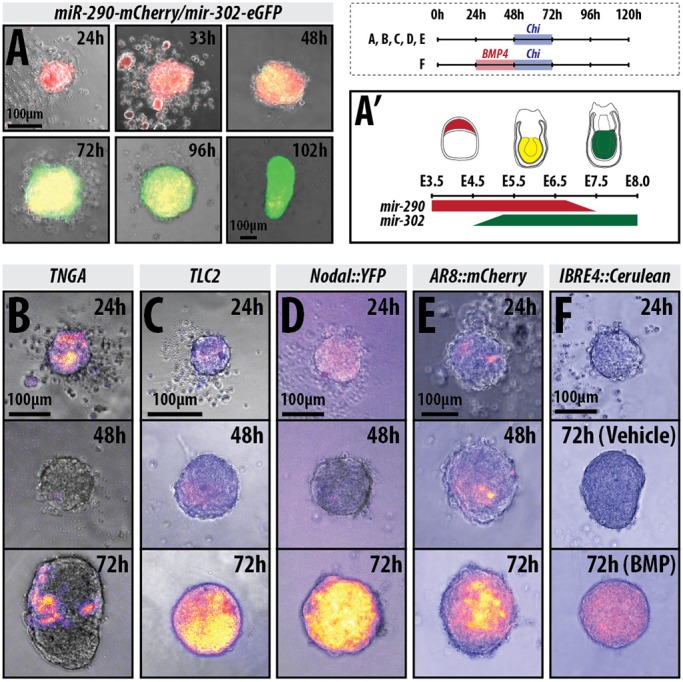
Fig. 2.

Gastruloids progress through stages similar to the early embryonic to late epiblast. (A) mir-290-mCherry/mir-302-eGFP gastruloids imaged by wide-field microscopy for 102 h (n=6 for 24-48 h and 8 for 72-120 h). The colour changes schematic is shown in A′ (see Parchem et al., 2014 and Turner et al., 2016b). (B-F) Gastruloids made from the (B) TNGA (n=21), (C) TLC2 (24 and 48 h n=84; 72 h n=42), (D) Nodal::YFP (Nodal expression; 24 and 48 h n=84; 72 h n=42) and (E) AR8::mCherry (Nodal signalling; n=14) and (F) IBRE4::Cerulean (BMP reporter; 24 h n=70; 48 and 72 h n=14) cell lines and treated with a pulse of Chi between 48 and 72 h AA (B-E), or pre-treated with a pulse of BMP4 (24-48 h) followed by a pulse of Chi (48-72 h; F). Schematic for the stimulation regime shown in the top-right corner. Scale bars: 100 μm.
