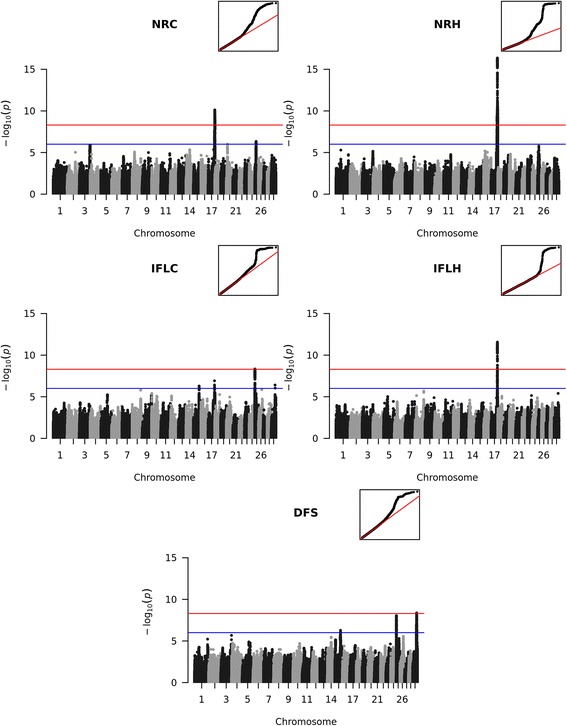
Fig. 1.

Manhattan plots for genome-wide association studies for fertility traits. The red line marks the Bonferroni corrected significance threshold. The blue line shows the threshold for suggestive variants. Small figures in the upper right corner show the qqplot of the p-values. NRC: Non-return rate in cows; NRH: Non-return rate in heifers; IFLC: Interval from first to last insemination in cows; IFLH: Interval from first to last insemination in heifers; DFS: Days to first service
