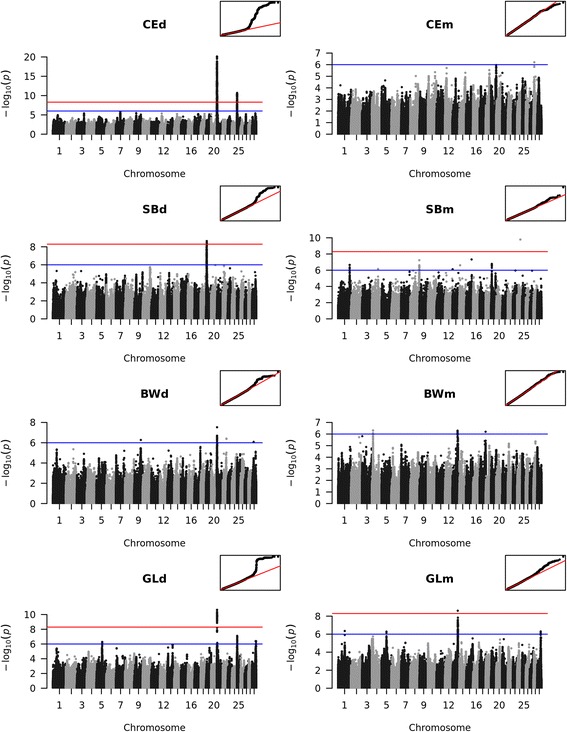
Fig. 4.

Manhattan plots for the genome-wide association studies for calving traits. The red line marks the Bonferroni corrected significance threshold. The blue line shows the threshold for suggestive variants. Small figures in the upper right corner show the corresponding qqplot. CEd: Calving ease direct; CEm: Calving ease maternal; SBd: Stillbirth direct; SBm: Stillbirth maternal; BWd: Birth weight direct BWm: Birth weight maternal; GLd: Gestation length direct; GLm: Gestation length maternal
