
Fig. 2.
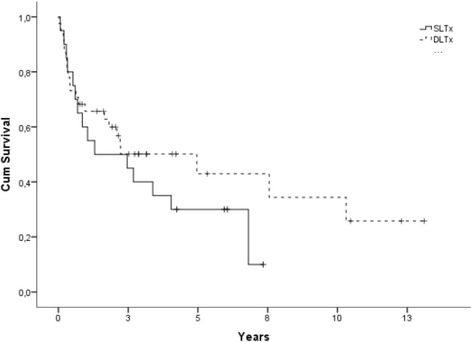
Kaplan-Meier figure displaying survival between SLTx and DLTx after development of BOS grade ≥ 2 until death/follow-up (p > 0. 05)
Official websites use .gov
A
.gov website belongs to an official
government organization in the United States.
Secure .gov websites use HTTPS
A lock (
) or https:// means you've safely
connected to the .gov website. Share sensitive
information only on official, secure websites.
Kaplan-Meier figure displaying survival between SLTx and DLTx after development of BOS grade ≥ 2 until death/follow-up (p > 0. 05)