Fig. 2.

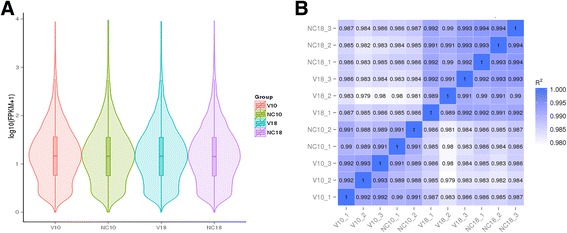
The quality assessment of RNA-Seq. a Violin diagram of the distribution of average FPKM values per sample group. b The correlation between all the samples shown as a squared Pearson correlation coefficient (R2)

The quality assessment of RNA-Seq. a Violin diagram of the distribution of average FPKM values per sample group. b The correlation between all the samples shown as a squared Pearson correlation coefficient (R2)