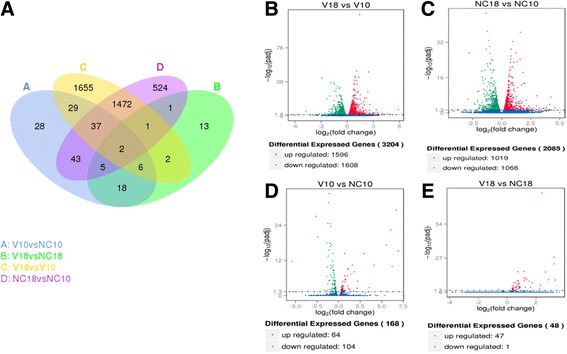
Fig. 3.

Overall analysis of ARV-mediated changes in gene expression. a Venn diagram of DEGs between all samples. b−e Volcano plots of DEGs from ARV-infected cells at 10 hpi to 18 hpi (b), mock-infected cells at 10 hpi to 18 hpi (c), and ARV-infected cells to mock-infected cells at each time point (d, e)
