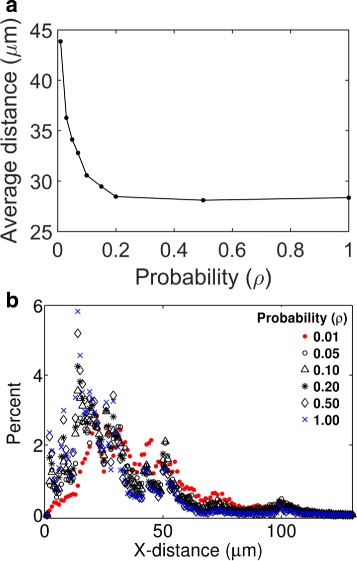
Fig. 8.

Predicted effects of cellular uptake rates on tissue distribution of nanoparticles. a Mean depth of tissue penetration by particles as a function of ρ. The mean depth of penetration represents the average of the horizontal positions (X-coordinate) of 16,000 simulated particles in 104 seconds after their tissue entry. b Histograms showing distribution of the nanoparticles. Each histogram corresponds to a different value of ρ, as indicated in the figure legend
