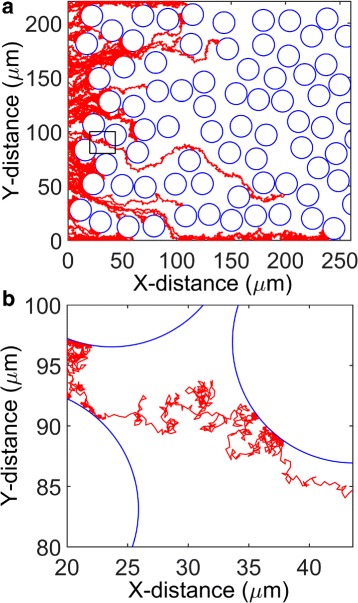
Fig. 9.

Representative travel paths of simulated nanoparticles. a Travel paths of 100 nanoparticles in the tissue domain. The particles are of identical size (100 nm radius). b A zoomed-in view showing a single particle travel path and its interaction with a cell boundary. Panel B corresponds to the small region in Panel A marked by a rectangle
