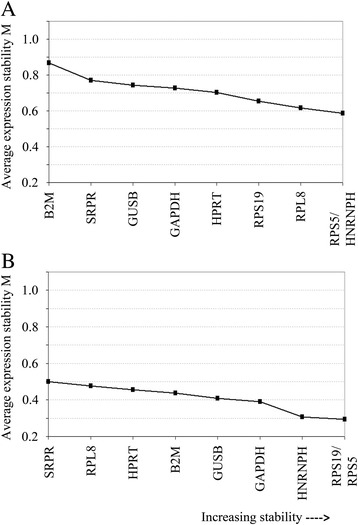
Fig. 2.

Expression plots generated by geNorm for a canine OS primary tumors and b canine OS cell lines for the average expression stability (M values) for the 9 tested genes upon step-wise exclusion method. Less stable genes were eliminated by the step-wise exclusion method and the average M value was re-calculated among the remaining candidate genes. The 2 most stable genes for OS primary tumors were RPS5 and HNRNPH, while RPS5 with RPS19 were the most stable combination among cell lines
