Figure 1.
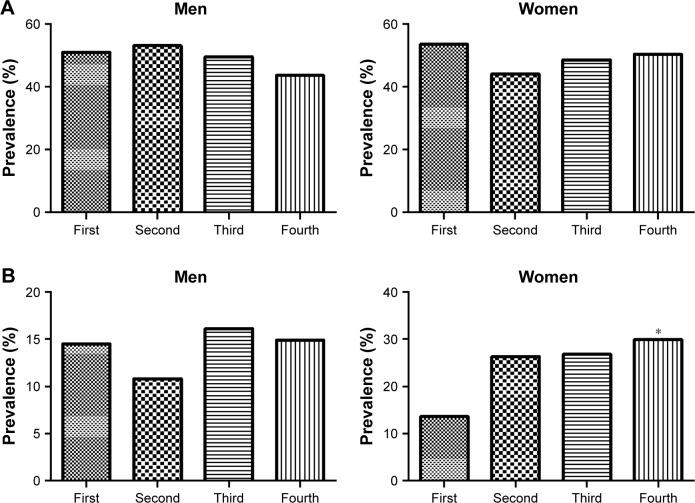
Differences in the prevalence of subjects with (A) osteopenia and (B) osteoporosis among serum cystatin C groups.
Notes: Serum cystatin C groups in men were: first (<0.9 mg/L), second (0.9 mg/L), third (1.0 mg/L), and fourth (≥1.1 mg/L). Serum cystatin C groups in women were: first (<0.8 mg/L), second (0.8 mg/L), third (0.9 mg/L), and fourth (≥1.0 mg/L). *P<0.05 vs first group from the chi-square test.

