
Fig. 7.
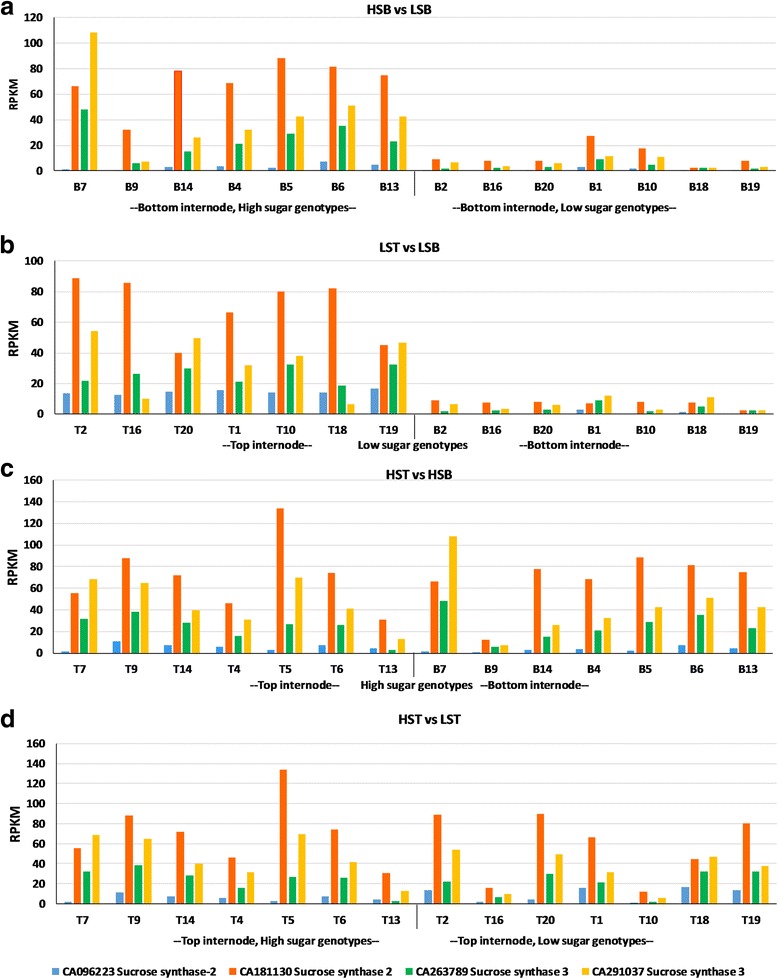
Graphical representation of the expression pattern of some of SuSy transcripts in various comparisons. LST, low sugar top internode sample; LSB, low sugar bottom internode sample; HST, high sugar top internode sample; HSB, high sugar bottom internode sample; T-top tissue; B-bottom tissue. Shown here are the sucrose phosphate synthase III, sucrose non-fermented related protein kinase, sucrose transport protein, impaired sucrose induction 1- like protein transcripts from Saccharum officinarum gene indices, SoGI database, showing differential expression in top two comparisons (a) HSB vs LSB; (b) LST vs LSB while there is no differential expression in lower two comparisons (c) HST vs HSB; (d) HST vs LST at FDR < 0.01. X-axis shows the genotypes while Y-axis represents RPKM values