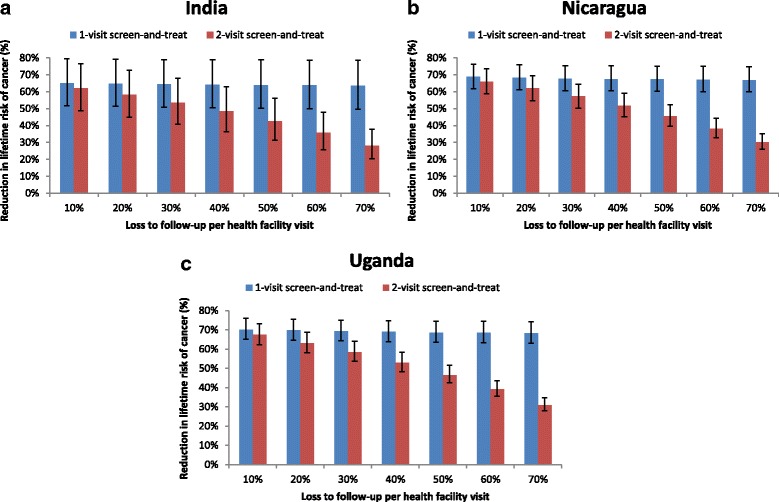
Fig. 2.

Reduction in lifetime risk of cancer associated with the 2-visit versus the 1-visit screen-and-treat strategy. Reduction in lifetime risk of cancer (y-axis) is displayed for screening three times in a lifetime at ages 30, 35, and 40 years with HPV DNA testing, as loss to follow-up per health facility visit is varied from 10% to 70% (x-axis) in a) India; b) Nicaragua; and c) Uganda. Cancer reduction associated with the 2-visit screen-and-treat strategy is represented by the red bars; the 1-visit screen-and-treat is represented by the blue bars. Error bars display the range in cancer reduction across the 50 calibrated input parameter sets
