Figure 3.
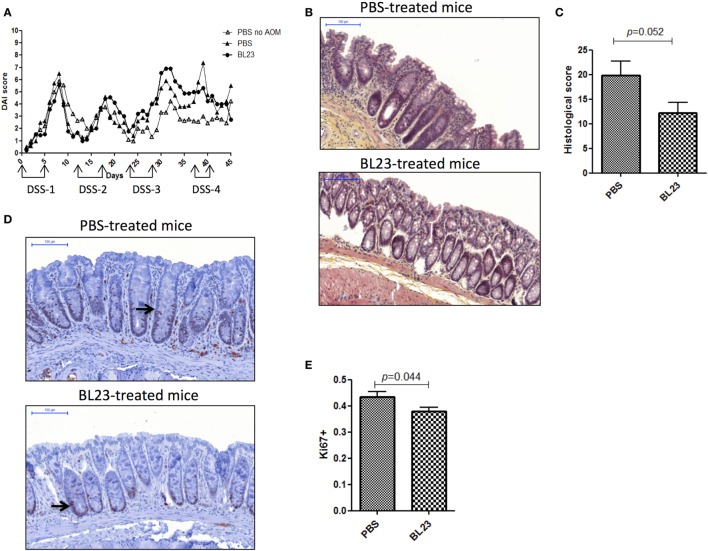
Macroscopic and histological assessment of inflammation and proliferation in mice. (A) Disease Activity Index score [dextran sodium sulfate (DSS) treatment periods are indicated on the graph]. (B) Representative H&E-stained images of colic tissues from either PBS- or BL23-treated mice at sacrifice; scale bars, 100 µm. (C) Semiquantitative scoring of histopathology (p = 0.044, Student’s t-test). (D) Representative Ki67-stained images from either PBS- or BL23-treated mice at sacrifice; scale bars, 100 µm; black arrow indicates Ki67 distribution inside the crypt. (E) Proliferative assessment (p = 0.052, Student’s t-test). Data are represented as the mean of each group ± SEM (n = 9 mice) for each graph. AOM, azoxymethane.

