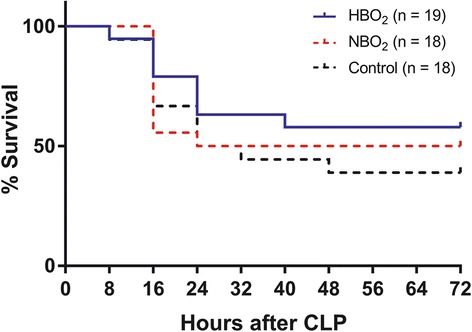
Fig. 2.

Kaplan-Meier curves showing the percentage survival in HBO2, NBO2 and control group during 72 h. HBO2, hyperbaric oxygen treatment; NBO2, normobaric oxygen treatment. HBO2 group compared to NBO2 group p = 0.59. HBO2 group compared to the control group p = 0.24. NBO2 group compared to the control group p = 0.59. Groups are compared using log-rank test
