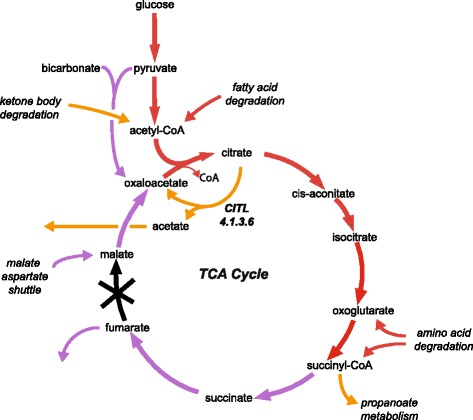
Fig. 2.

Summary of the compensatory pathways used by the MitoCore and Recon 2.2 models when simulating fumarase deficiency with the objective function of maximum ATP. (Red arrows represent reactions active in both models; purple arrows are only active in the MitoCore model; and orange arrows are only active in the Recon 2.2 model)
