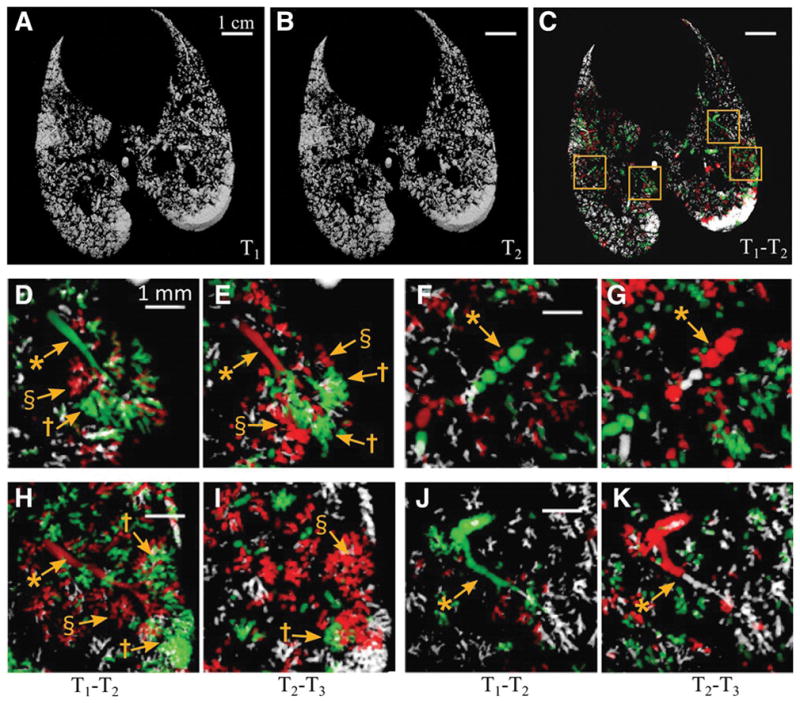
Figure 1. Alveolar recruitment/derecruitment occurring alternately in neighboring lung units over short time scales ~1 min, in injured lung at PEEP 6 cmH2O.

A,B,C :3D renderings of aerated lung regions obtained by segmentation of Synchrotron phase-contrast CT images at 0 s (A) and 84 s (B) in a 2.5 mm thick slice, in injured lung at PEEP 6 cmH2O; C: Recruitment/Derecruitment map quantified using image registration between T1 (A) and T2 (B). White: aerated, no change; Black: non aerated, no change; Green: Opening; Red: Closing. Yellow squares delineate regions of interest magnified in panels D–K with D,F,H,J computed from 2 successive images acquired at 0 and 84 s (T2 – T1) and E,G,I,K from the subsequent time interval between 84 and 159 s (T3-T2). *: bronchioles; †: recruiting airspaces; §: derecruiting airspaces. Raw images are shown in the online supplement (Figure S3).
