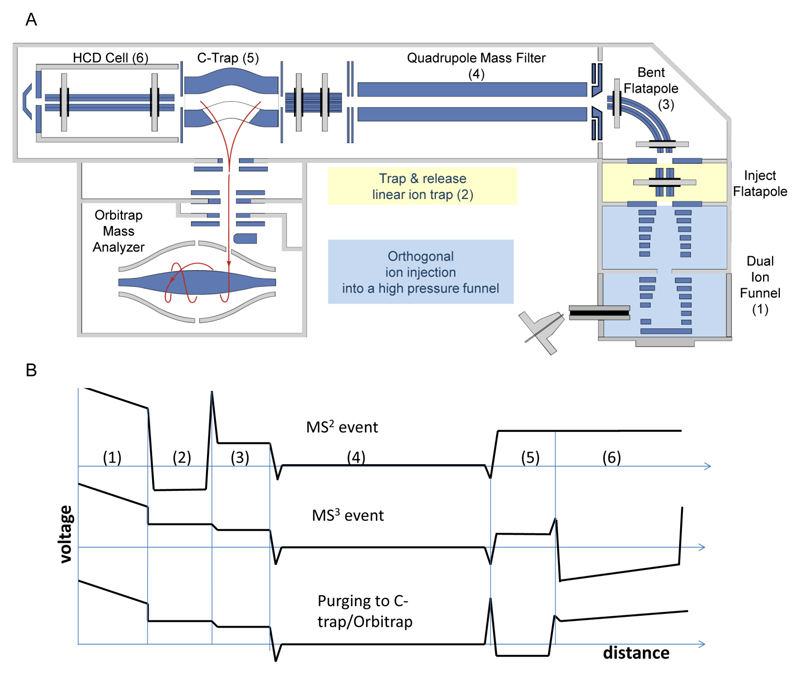
Figure 1. Schematic diagram of the modified Q Exactive Plus mass spectrometer, enabling MS3 analysis.
(A) Modifications were introduced in the front section of the instrument (highlighted in colors). Specifically, a pressure-regulated dual-funnel interface was used for improving desolvation and enhancing sensitivity (blue) in the manner described in24. In addition, a trap-and-release mode of analysis was enabled in the inject flatapole by a front-end trap, to allow pseudo-MS2 measurements (yellow). A pressure control valve was coupled to the Edwards forepump to enable fine pressure adjustment in the Lower Pressure Funnel (LPF) region and to optimize ion trapping and activation in the front-end trap. (B) Profiles of experimental voltages applied during three different events. These include: i) ejection of protein subunit from an intact protein complex (MS2); ii) fragmentation of the ejected subunits in the HCD cell (MS3), and iii) purging of fragment ions from the HCD cell into the C-trap for subsequent Orbitrap detection.

