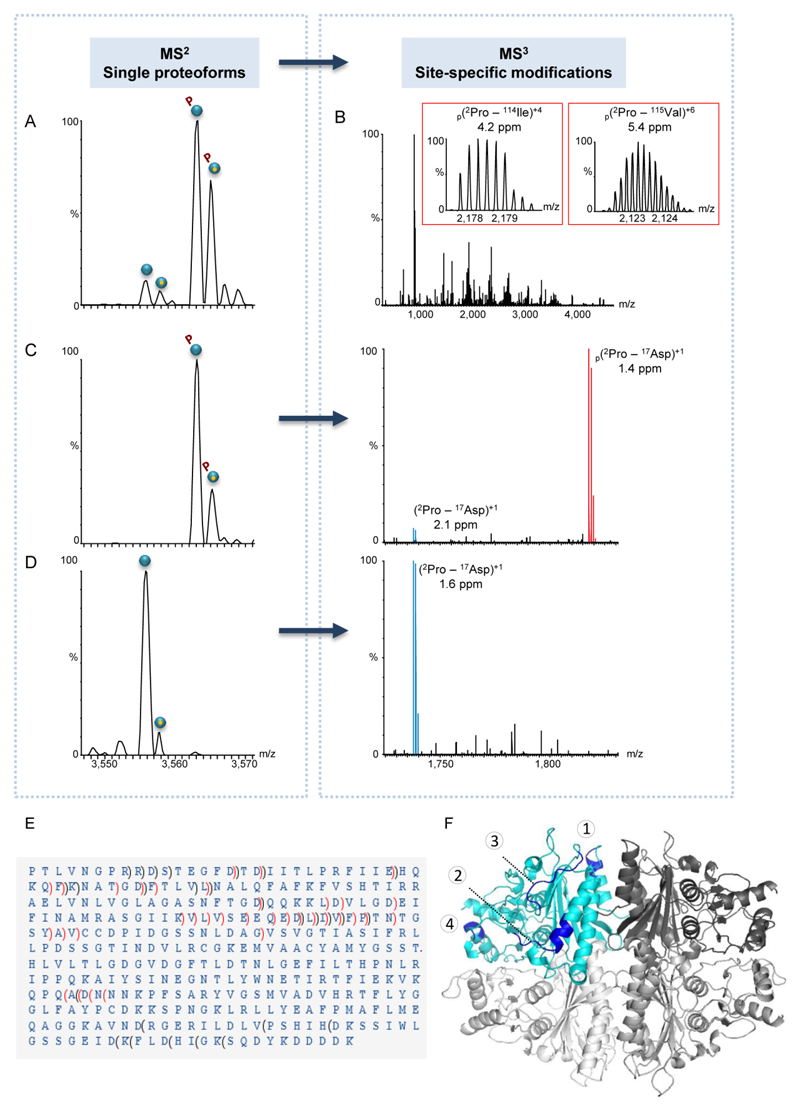
Figure 4. MS3 fragmentation data unravels the existence of two different phosphorylation sites.
(A-D) Representative spectra of FBP1 monomer purified from yeast grown in a glucose-containing medium. In general, individual proteoforms identified in the MS2 spectrum (A) were selected within the quadrupole mass filter and subjected to MS3 fragmentation (B). The insets show fragment ion matches of two b ions, representing identified phosphopeptides. For each fragment, the position, charge and mass accuracy are indicated. Phosphorylated fragments are labeled by p. In all generated MS3 spectra, fully resolved multiply charged fragment ions were detected using a mass resolving power of 140,000. (C-D) Selective MS2 isolation of mono-phosphorylated or unmodified FBP1 proteoforms. For each proteoform selected, the respective MS3 spectrum is shown on the right panel of (C) or (D). Expansion of the 1,700-1,900 m/z region of MS3 data generated upon specific proteoform selection and fragmentation, showing the b16 ion, which matches the 2PTLVNGPRRDSTEGFD17 sequence. The data indicates that the b16 phosphopeptide (labeled in red) is exclusively found in the MS3 spectrum of the mono-phosphorylated FBP1 and not in that of the unmodified proteoform. (E) Analysis of MS2 and MS3 spectra revealed that the FBP1 protein is missing the initial Met, and that it is phosphorylated at two mutually exclusive sites: at either position 12Ser/13Thr or within the stretch of 248Asn-310Asp. In the latter, due to low fragmentation efficiency in this specific region, the exact phosphorylation position could not be mapped. b ions are indicated by brackets pointing towards the N-terminus and y ions are indicated by brackets pointing towards the C-terminus. Non-phosphorylated fragments are indicated in black, phosphorylated fragments are indicated in red. (F) A model of the FBP1 tetramer, demonstrating surface-exposed fragmentation hotspots. One subunit is colored in cyan and the other three are in different shades of gray. Fragmentation hotspot sequences are 30HQKQFK35, 79DQQKKLDVLGD89, 110QEDLIVFPT118 and 229WNETI233 (labeled by numbers 1- 4 respectively). The model highlights the structural organization of the complex, which is assembled from a dimer of dimers, in accordance to our results (Fig. S4).

