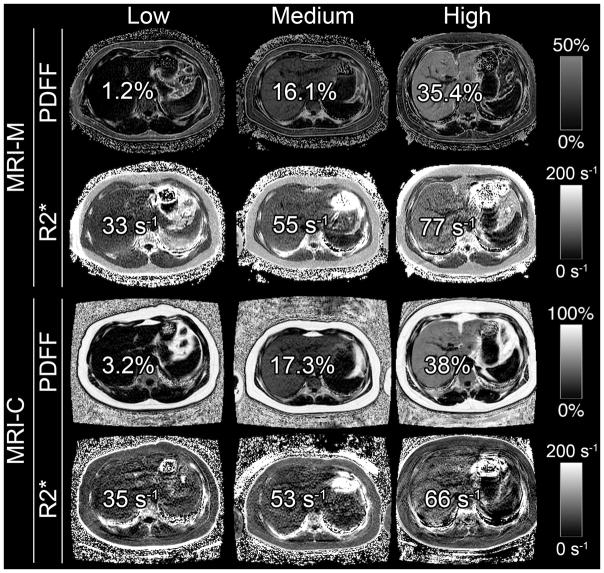
Figure 2.
Hepatic PDFF and R2* maps of three representative pediatric research participants with low, medium, and high PDFF and R2* values (values overlain) on MRI-M and MRI-C. PDFF and R2* were estimated in co-localized regions of interest. These images illustrate the relationship between hepatic PDFF and R2*. Dynamic scale for parametric PDFF map is 0–50% for MRI-M and 0–100% for MRI-C; dynamic scale for parametric R2* map is 0–200 s−1 for both MRI-M and MRI-C.

