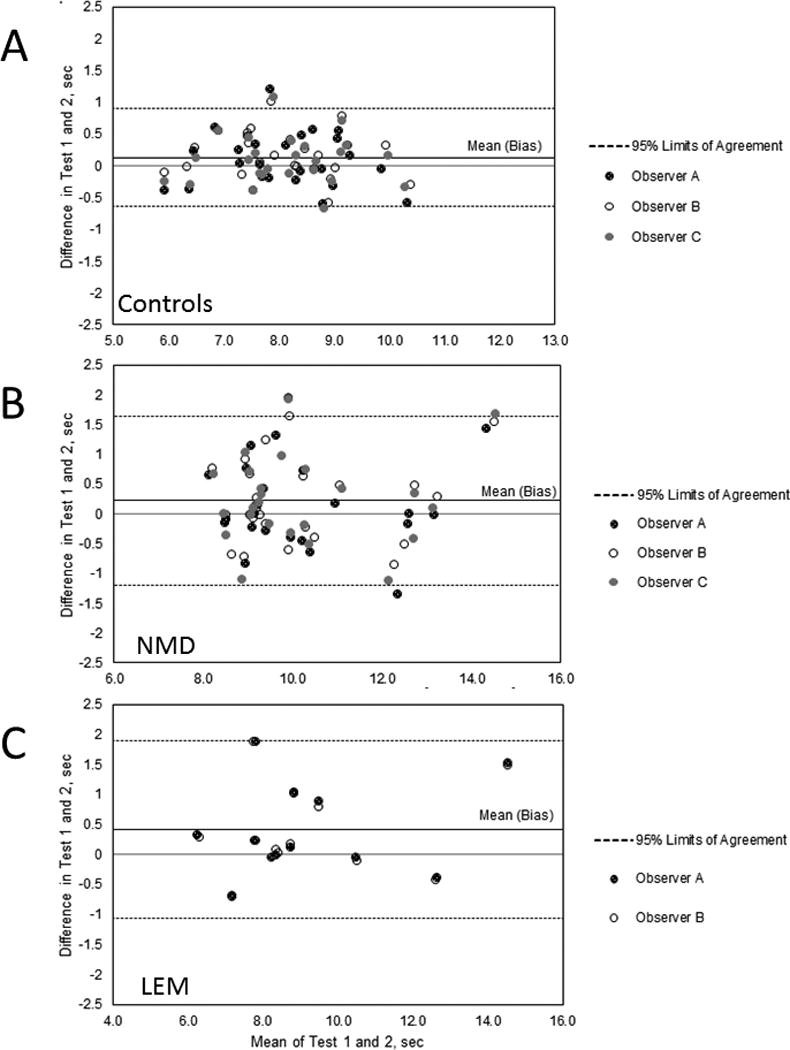
Figure 1. Test-Retest Comparisons.

Bland-Altman plots of data from Test 1 and Test 2. The top solid line in each plot shows the bias.
A. Controls. Data from 75 paired 3TUG times measured by 2 live and 1 blinded observer on 25 control subjects. All test-retest differences are less than 1.25 seconds and 71/75 are within +/− 1.96SD of the mean. The measurement for Test 1 was on average 0.13 sec greater than that for Test 2.
B. Neuromuscular disease. Data from 72 paired 3TUG times for Test 1 and Test 2 measured by 2 live and 1 blinded observer on 24 patients with non-LEM neuromuscular disease. All test-retest differences are less than 2 seconds and 67/72 are within +/− 1.96SD of the mean. The measurement for Test 1 was on average 0.22 sec greater than that for Test 2.
C. LEM. Data from 24 paired 3TUG times for Day 0 and Day 1 from a live and a blnded observer on 12 LEM patients. All test-retest differences are less than 2 seconds and 22/24 are within +/− 1.96SD of the mean. The measurement for Test 1 was on average 0.42 sec greater than that for Test 2.
