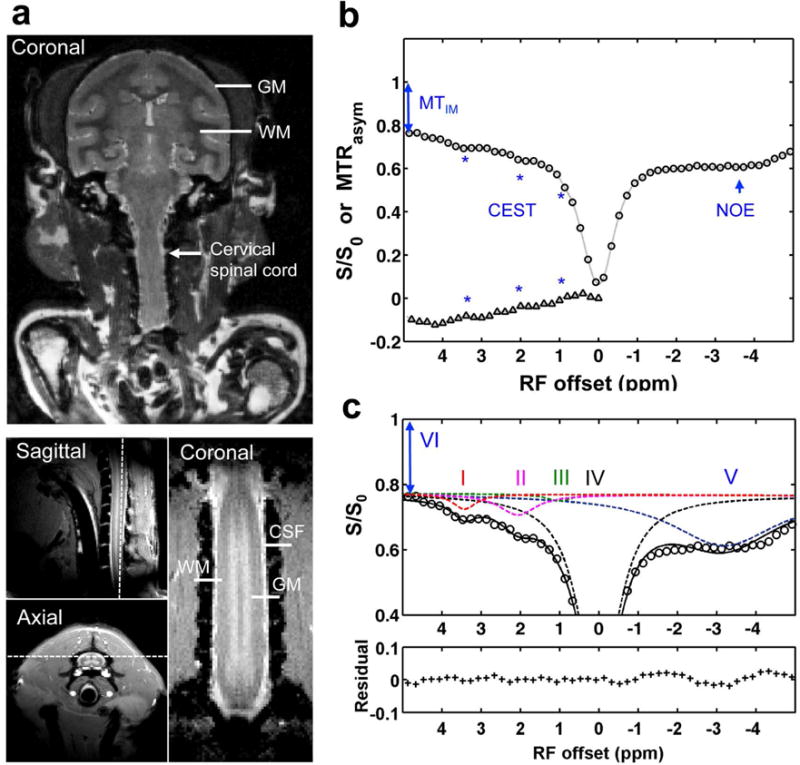
Fig. 1. Data acquisition and quantification of Z-spectrum for squirrel monkey.

(a) Characteristic anatomical images of brain (T2-weighted) and spinal cord (MTC) used for planning CEST imaging. The white arrow indicates the cervical spinal cord. Dashed white lines indicate the selected single coronal slice for acquiring CEST data. GM: gray matter; WM: white matter; CSF: cerebrospinal fluid. (b) Conventional MTRasym analysis, showing Z spectrum (circle) and MTRasym curve (triangle) after Bo correction. The asterisks indicate the CEST effects. The 2-head arrow indicates semisolid MT effect at 5 ppm RF offset (VI), and the 1-head arrow indicates nuclear Overhauser enhancement (NOE). (c) Multi-pool Lorentzian band fitting, with peaks assigned at RF offset frequencies (Δi) of 3.5 (I), 2.2 (II), 1.2 (III), 0 (IV), and −3.3 (V) ppm, for amide, amine, hydroxyl, free water, and aliphatic proton pools, respectively. The amplitude and width of the peaks were allowed to vary in achieving the best fit. The bottom half of the figure shows the residuals between the sum of the fitted peaks and the original data.
