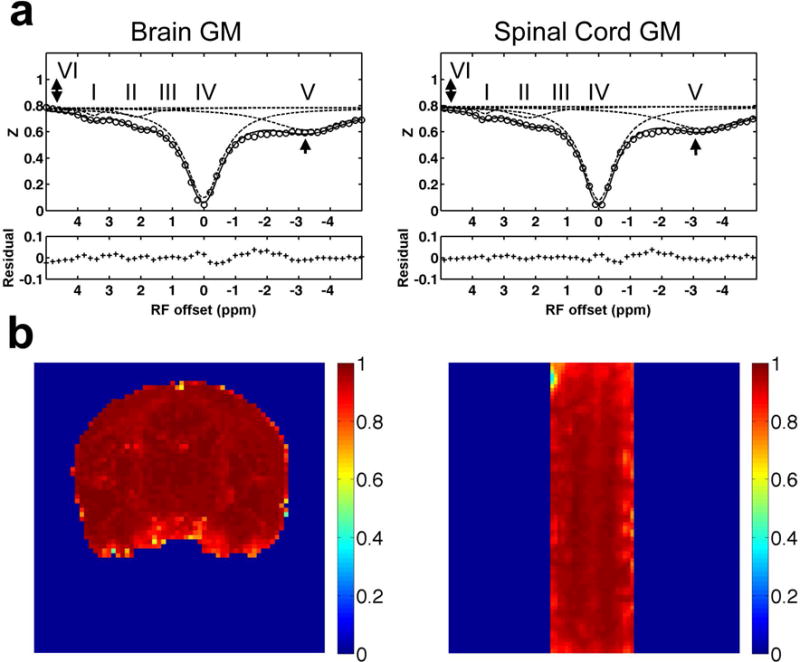
Fig. 2. Comparison of features in Z-spectra of normal brain and cervical spinal cord of squirrel monkey.

(a) Comparison of the averaged Z-spectra of GM in brain and spinal cord. The 2-head arrows indicate semisolid MT effect, and the 1-head arrow indicates nuclear Overhauser enhancement (NOE). The labels of multiple proton pools are the same as those in Figure 1. (b) Pixel-by-pixel correlation r maps showing the Pearson correlation coefficient of the Z-spectrum at each pixel with the averaged Z-spectrum of GM of the brain (left) or spinal cord (right).
