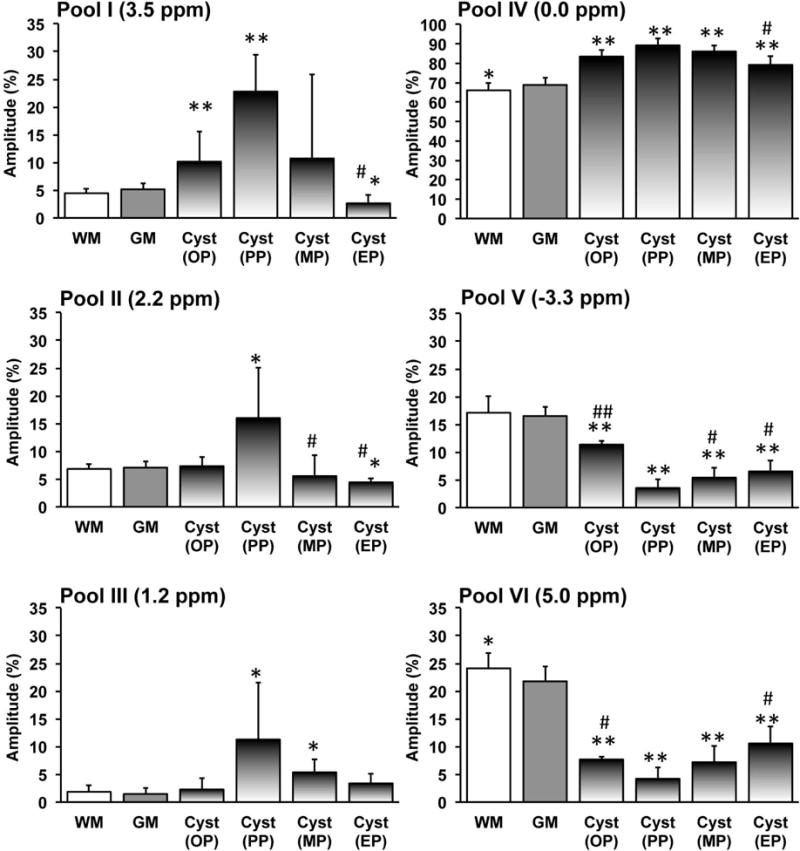
Fig. 8. Group longitudinal quantifications of pool amplitudes of the cysts during recovery.

Percent peak amplitudes (mean and standard deviation across subjects) for pools I–V and percent MTIM value for pool VI of GM and WM (12 normal subjects) and the cysts (5 SCI subjects). Cyst development has been divided into four periods. The stage when cyst occurred was defined as onset (OP), the stage when the CEST effect of cyst was maximum during the progress was defined as peak (PP), the stage when the CEST effect of cyst was minimum was defined as end since it is the end time point in the longitudinal study (EP), and the stage between PP and EP is defined as middle point during recovery (MP). * p < 0.05 and ** p < 0.001 vs. relative value of normal GM. # p < 0.05 and ## p < 0.001 vs. relative value at peak point (PP).
