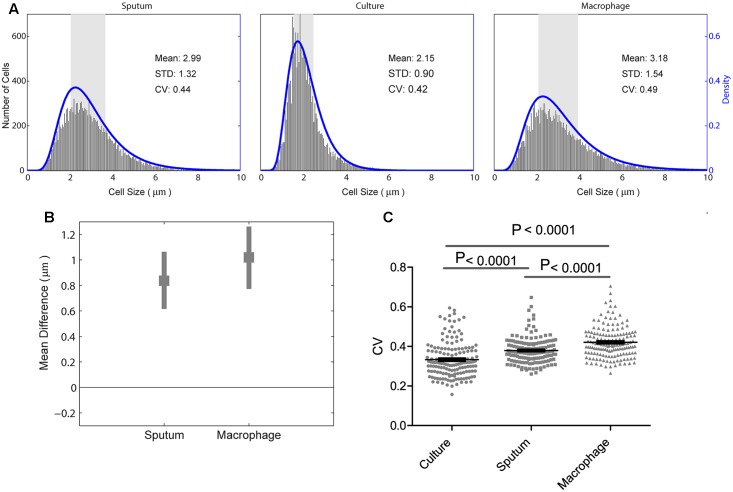
FIGURE 2.
Mycobacterium tuberculosis cell-length distribution and CV between sputum, macrophage infection, and culture. (A) Absolute number of M. tuberculosis cell-length distribution (corresponding to right y-axis) combined from all the strains in sputum, culture, and infected macrophages (macrophage) are shown. The blue lines (corresponding to the right y-axis) are maximum-likelihood estimation for M. tuberculosis cell-length distribution. The gray rectangle represents the interquartile range of cell length. (B) Difference in mean M. tuberculosis cell length was compared between liquid culture and host conditions such as sputum and infected macrophages. Average mean difference (gray square dots) and 95% confidence interval (CI) (gray bars) of cell length in sputum, infected macrophages compared to liquid culture (base line corresponding to zero) by bootstrap method. If the average mean difference and 95% CI does not include zero for a group, then there is a significant difference in the mean cell length between that group and the base line. (C) Individual M. tuberculosis strains CV in culture, sputum, and infected macrophages, P-values by ANOVA, and Mann–Whitney test. SD, standard deviation; CV, coefficient of variation.

