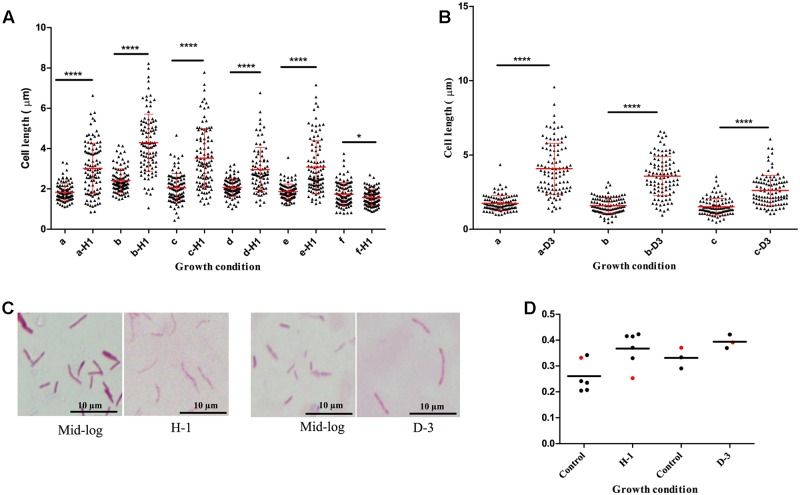
FIGURE 4.
Mycobacterium tuberculosis cell-length distribution in individual strains under oxidative stress and iron deficiency. (A) M. tuberculosis cell-length distribution under oxidative stress (a-H1 to e-H1) five clinical M. tuberculosis strains and (f-H1) laboratory strain H37Rv treated with 21 mM H2O2 along with respective untreated mid-log controls (a–f). (B) M. tuberculosis cell-length distribution under iron deficiency (a-D3 and b-D3) two clinical M. tuberculosis strains, and (c-D3) laboratory strain H37Rv treated with 500 μM DFO along with respective untreated mid-log controls (a–c). In each strain n = 100 cell length in each condition. P-values by Mann–Whitney U-test, ∗P < 0.05, ∗∗P < 0.01, ∗∗∗P < 0.001, and ∗∗∗∗P < 0.0001. (C) ZN staining of a clinical M. tuberculosis strain from oxidative stress (H-1) and iron deficiency (D-3) along with mid-log controls. (D) CV of M. tuberculosis strains from oxidative stress (H-1) and iron deficiency (D-3), black circle indicates clinical M. tuberculosis strains and red circle represents H37Rv. DFO, deferoxamine mesylate salt.

