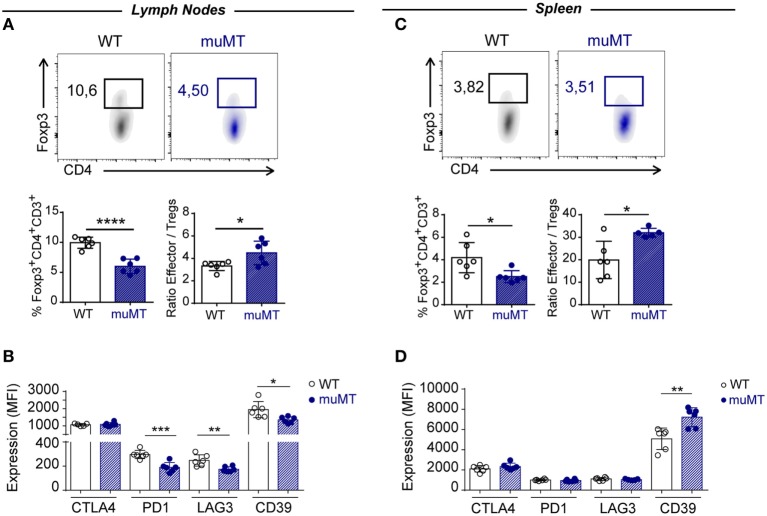
Figure 7.
Infected muMT mice exhibit a low percentage of Foxp3+ Tregs. (A,C) Representative dot plots of the percentage of Foxp3+ cells gated on CD4+CD3+ T cells of (A) lymph nodes and (C) spleen from wild-type (WT) (n = 6) and muMT (n = 6) infected with 10,000 trypomastigotes of Trypanosoma cruzi, obtained at 15 days post infection (Dpi). Bars represent mean ± SD of the percentage of Foxp3+CD4+CD3+ T cells and the ratio between effectors CD4+ CD3+ T cells and Foxp3+ Tregs. (B,D) Expression of CTLA4, PD1, LAG3, and CD39 on Foxp3+CD4+CD3+ T cells of (B) lymph nodes and (D) spleen from infected WT and muMT mice obtained at 15 Dpi. Bars represent mean ± SD of inhibitory receptor expression on Foxp3+ Tregs, determined by geometric mean. Each symbol represents an individual mouse (*p < 0.05, **p < 0.01, ***p < 0.001, ****p < 0.0001; two-tailed t-test).

