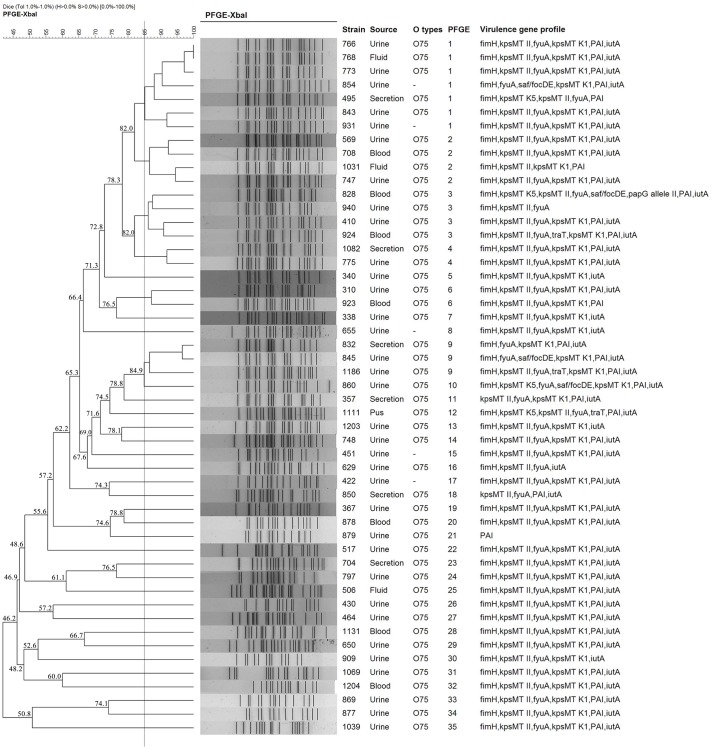
FIGURE 1.
Dendrogram of the PFGE patterns of chromosomal DNA restriction fragments from 51 ST1193 Escherichia coli isolates. The dendrogram was constructed using the UPGMA method. Dice coefficients (percentages) are listed in the scale on the top of the dendrogram. Strain number, sample source, O serotype, PFGE patterns and virulence factors (VFs) are included.

