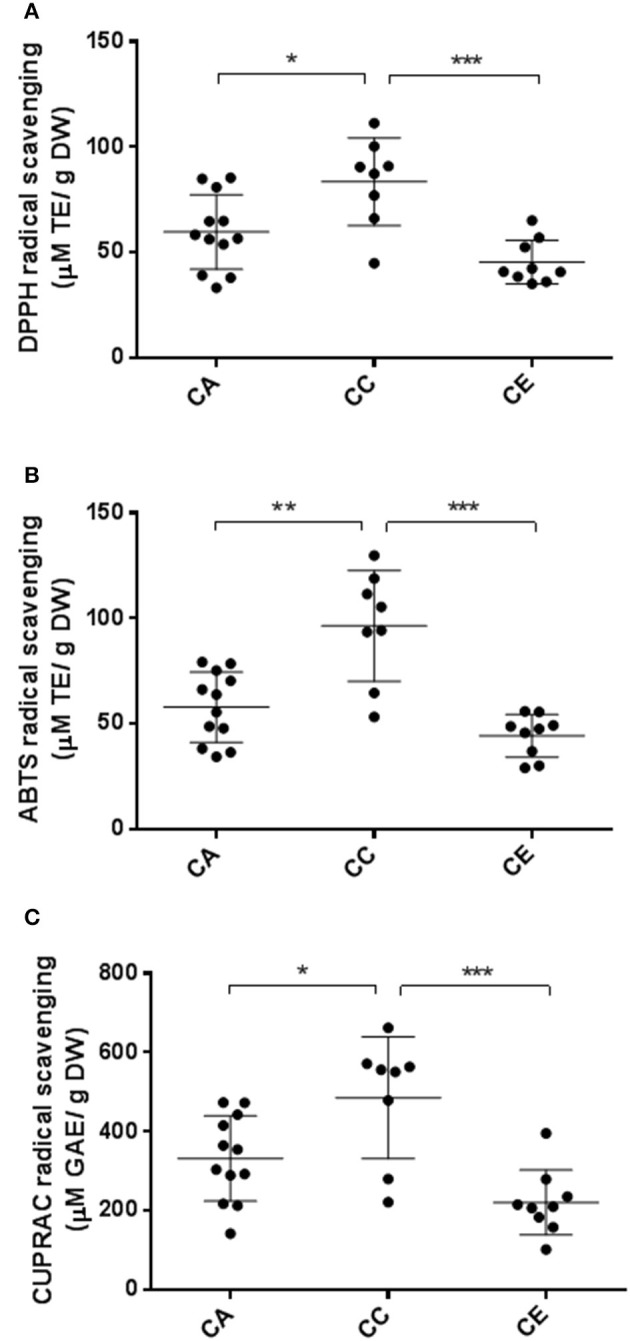
Figure 9.

Variations in antioxidant capacity of the three Centella species. CA, C. asiatica; CC, C. cardiofolia; and CE, C. erecta. DPPH (A) and ABTS (B) data were expressed as micromole Trolox equivalents per gram of dried weight (μM TE/g DW). CUPRAC (C) data are presented as micromole gallic acid equivalents per gram of dried weight ((μM GAE/g DW). The error bar was calculated from SD. Tukey method, ANOVA *p < 0.05; ** p < 0.01; ***p < 0.001.
