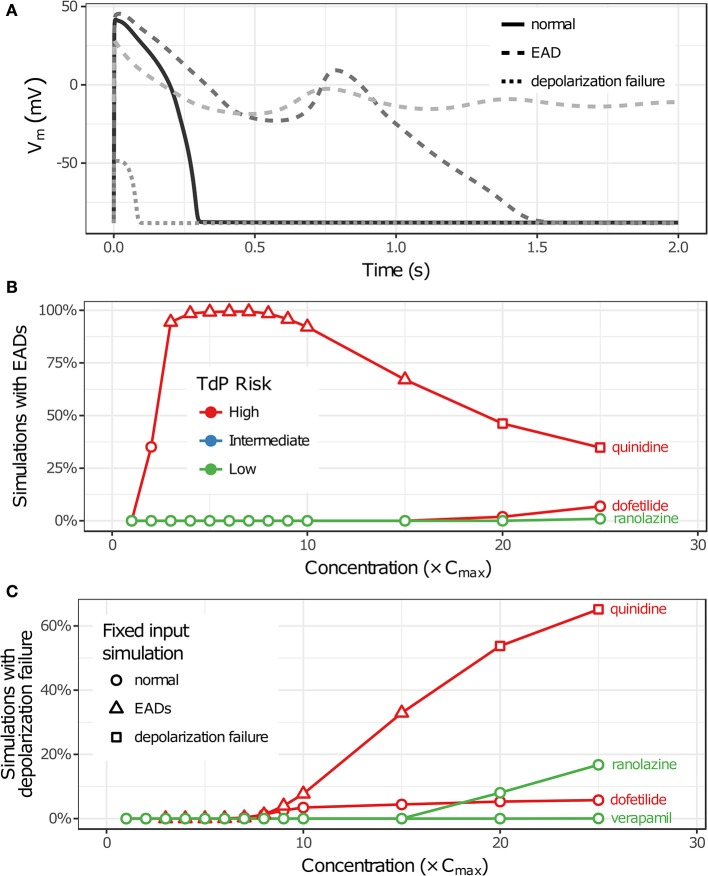
Figure 5.
Repolarization and depolarization abnormalities in AP simulations. (A) Traces showing representative examples of beats with normal APs (solid), EADs (dashed), or depolarization failure (dotted). (B,C) The percentage of uncertainty-input simulations (2,000 total) in which EADs occurred (B) or which had complete depolarization failure (C) is shown as a function of drug concentration in (B,C), respectively. Only results for drugs that had these events at the simulated concentrations (1−25× Cmax) are plotted. (Note that ranolazine had 19 simulations with EADs at 25× Cmax; verapamil only had one instance of depolarization failure occurring at 25× Cmax.) Markers indicate whether simulations with fixed inputs produced normal Aps (circles), EADs (triangles), or depolarization failure (squares).

