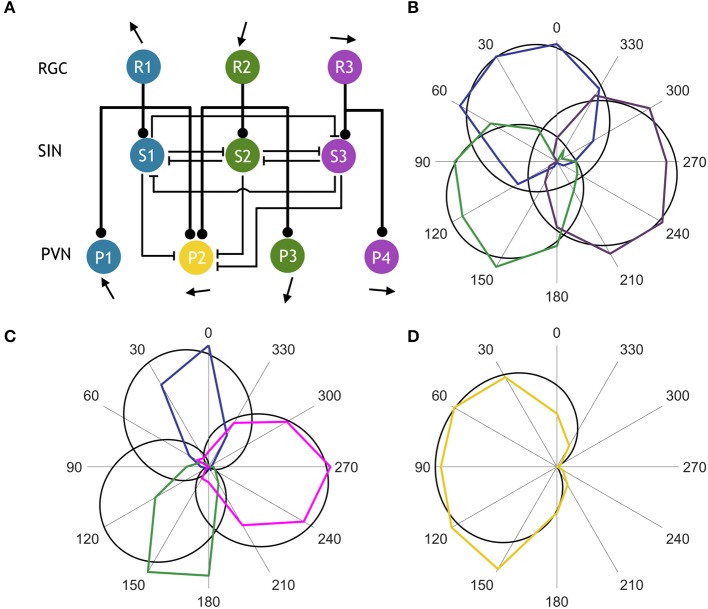
Figure 3.
Computational model of the direction selective tectal circuit. (A) Circuit motif showing a population of PVNs integrating input from two RGC populations and three SIN populations. Rounded arrowheads represent excitatory connections, flat arrowheads represent inhibitory connections, and pointed arrows indicate preferred stimulus direction. (B) Comparison between experimentally observed (colored) and simulated (black) normalized RGC tuning curves. (C) Normalized tuning curves of observed (colored) vs. simulated (black) SINs. (D) Normalized tuning curves of observed (colored) vs. simulated (black) PVN population tuned to rostral-to-caudal directed motion.

