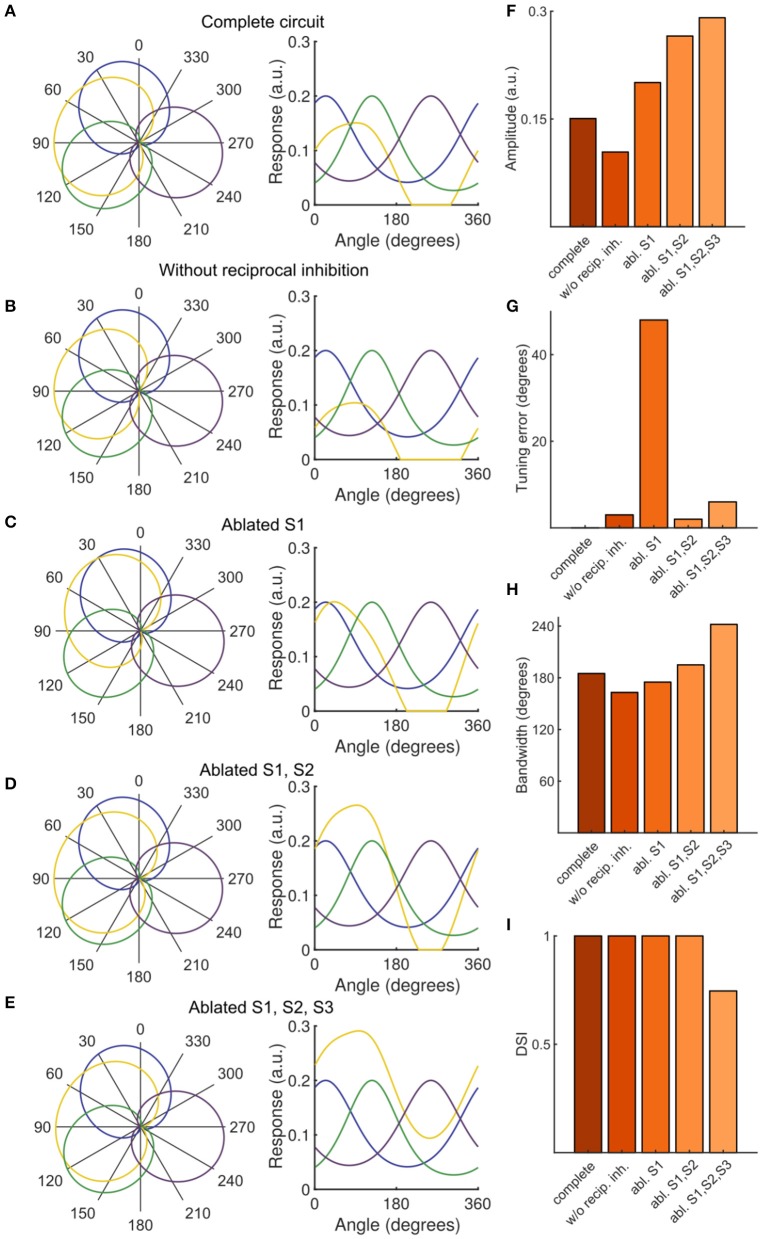
Figure 4.
Contribution of SINs to stimulus tuning in simulated PVN populations. (A–E) PVN population tuning curves under various circuit perturbations, presented as polar plots with normalized data (left) and plots with unnormalized data (right). (F) Amplitude of PVN type P2 (the emergent population tuned to rostral-to-caudal directed motion) under simulated manipulations. (G) Tuning error of P2, defined as the absolute difference between the experimentally observed direction preference and the simulated direction preference. (H) FWHM bandwidth of P2 tuning curve. (I) DSI of P2.

