Figure 5.
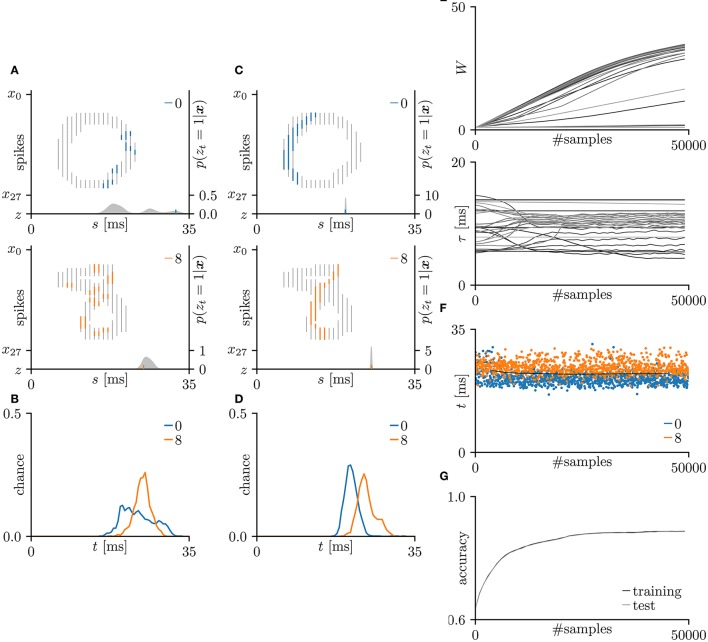
Results of SNN based on the Multinoulli-Bernoulli mixture model, evaluated on the hand-written digits 0 and 8 in the MNIST dataset (LeCun et al., 1998). (A) Representative spatio-temporal spike patterns of digit 0 (top panel) and digit 8 (bottom panel), and the post-synaptic spikes zt = 1 before learning. Thick colored lines indicate the pre-synaptic spikes xis = 1, elicited within μ − 1 < Δt = s + τi − t < μ + 1 for zt = 1; other pre-synaptic spikes xis are depicted as thin gray lines (the left vertical axes). Gray shaded areas denote the probability of eliciting a post-synaptic spikes zt = 1 per 1 ms (the right vertical axes). (B) Test distributions of the post-synaptic spike timings zt = 1 before learning. (C) Post-synaptic spike timings zt = 1 after learning, given the spatio-temporal spike patterns x in (A). (D) Test distributions of the post-synaptic spike timing zt = 1 after learning. (E) Trajectories of the synaptic weights Wi and conduction delays τi during the learning procedure. The darkest lines denote the values of the parameters W0 and τ0, and the lighter lines denote Wi and τi for i = 1, 2, … . (F) Random samples of the post-synaptic spike timings zt = 1. The black solid line marks the decision boundary between spike patterns the hand-written digits 0 and 8. (G) Classification accuracy in the training and test datasets, each averaged over 100 trials.

