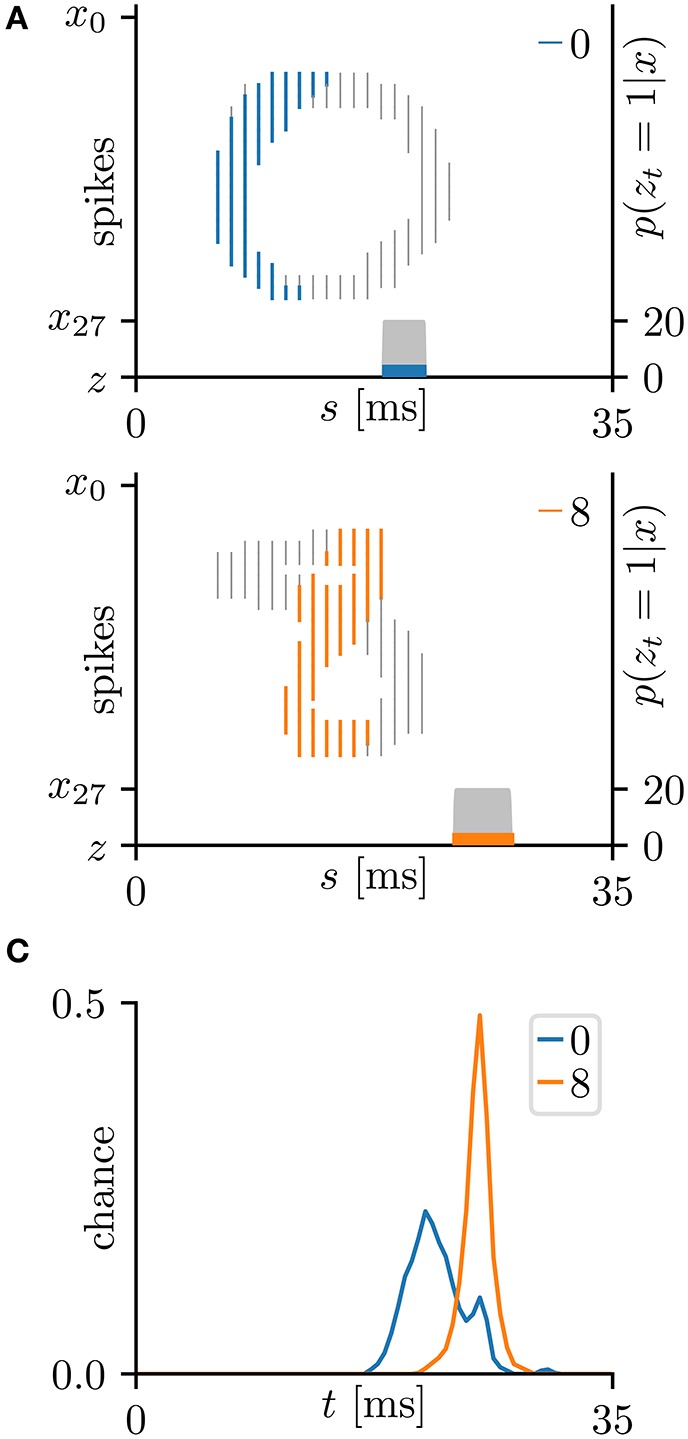
Figure 7.

Results of SNN based on the Bernoulli–Bernoulli mixture model for the hand-written digits 0 and 8 in the MNIST dataset (LeCun et al., 1998). (A) Representative spatio-temporal spike patterns of digit 0 (top panel) and digit 8 (bottom panel), and the post-synaptic spikes zt = 1 after the learning procedure as per Figure 5C. Thick colored lines indicate the pre-synaptic spikes xis = 1, elicited within μ − 1 < Δt = s + τi − t < μ+1 for zt = 1; other pre-synaptic spikes xis are depicted as thin gray lines (the left vertical axes). Gray shaded areas denote the probability of eliciting a post-synaptic spikes zt = 1 per 1 ms (the right vertical axes). (B) Test distribution of mean timings of the post-synaptic spikes zt = 1 after learning. Like the Multinoulli-Bernoulli mixture model (see Figure 5), the SNN selectively responds to the C-shaped edges.
