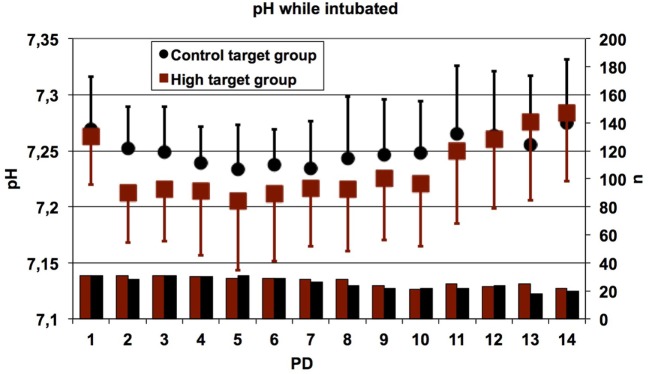
Figure 6.
Daily mean values of the pH in all patients who were intubated at the time of measurement. Error bars indicate SDs; lower bars indicate numbers of patients contributing data. The pH values were significantly lower in patients randomized to the high target group as compared to the control target group (linear mixed effects regression model, p < 0.0001). The main reason for absent data was extubation. PD, postnatal day.

