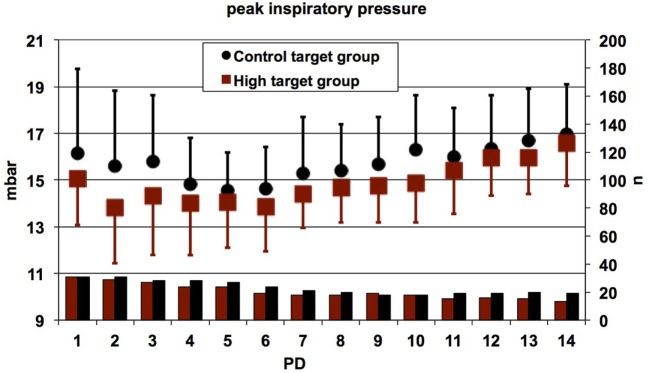
Figure 7.
Daily mean values for the peak inspiratory pressure (PIP) in conventionally ventilated patients. Error bars indicate SDs; lower bars indicate numbers of patients contributing data. The PIP values were significantly lower in patients randomized to the high target group as compared to the control target group (linear mixed effects regression model, p = 0.01). The main reason for absent data was the use of high-frequency oscillatory ventilation or proportional assist ventilation or extubation. PD, postnatal day.

