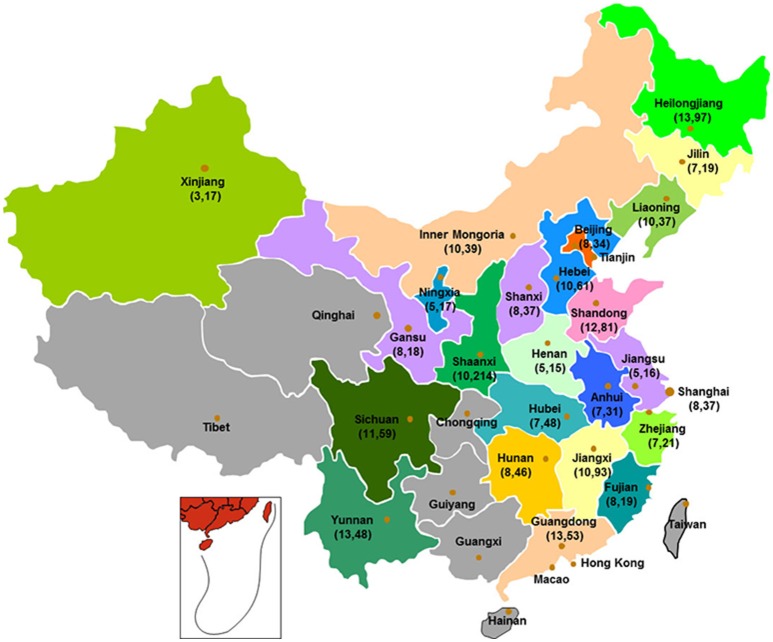
Figure 1.
Map of China showing the location of the 24 provinces where the retail food samples were collected. The provinces marked in gray did not included in this study, while the other 24 provinces, where the retail food samples were collected, were marked colorfully. The numbers enclosed in parenthesis is the number of sampling cities (before the comma) and isolates (after the comma), respectively.

