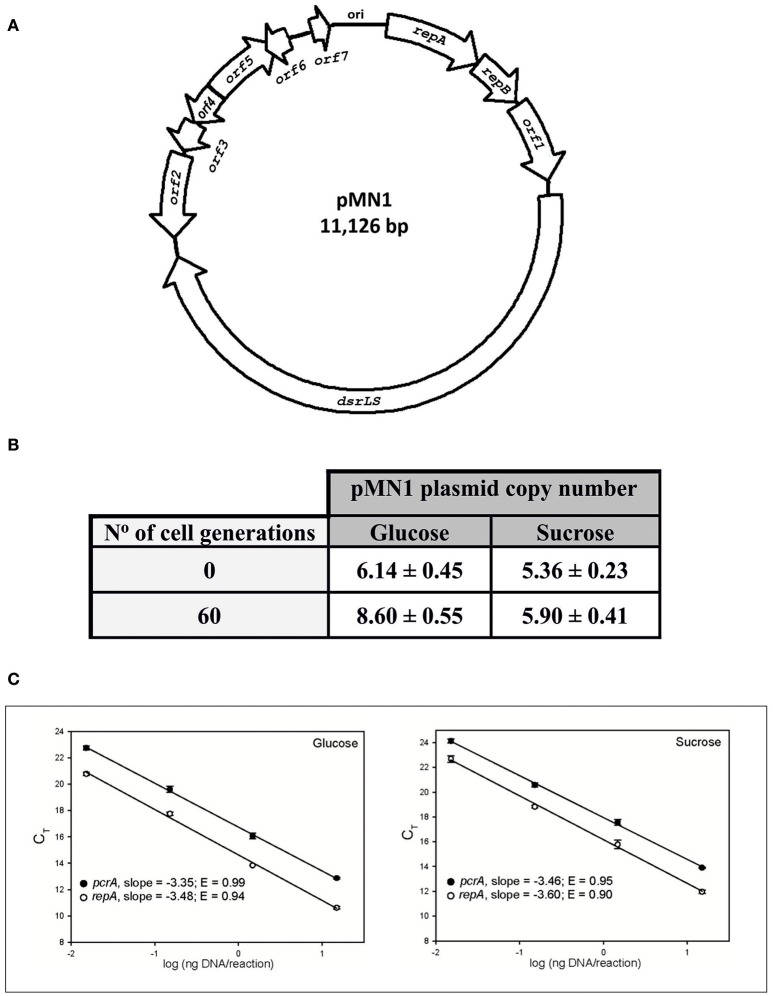
Figure 2.
Genetical map of plasmid pMN1 (A) and determination of its copy number (B,C). (A) The genes and orf of pMN1 are depicted. (B) Results of the pMN1 copy-number determination are summarized in this table. (C) For each gene, determined mean Ct values were plotted against the logarithm of the four amounts of template DNA used in the qPCR assays. PCR amplification efficiencies (E values) were calculated from the slope of the curves generated by linear regression through the experimental points.

