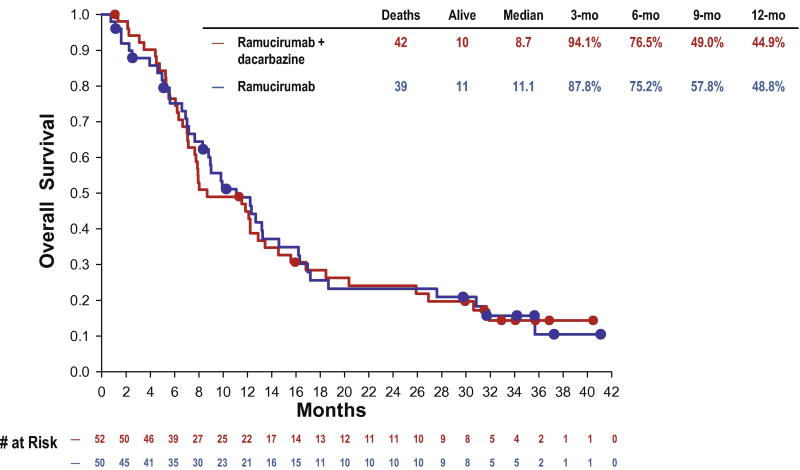
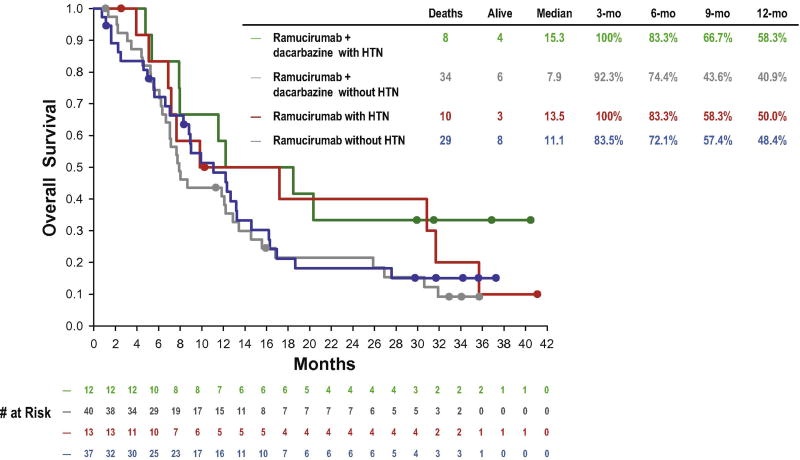
Figure 2.
a. Kaplan-Meier plot for overall survival by treatment arm of mITT population.
b. Exploratory analyses of the effect of an AE of hypertension of overall survival (OS), (mITT population). Kaplan-Meier plot for OS of patients with or without an AE of hypertension (n=12 in Arm A; n=13 in Arm B). In both treatment arms, the median OS appeared longer in patients with an AE of hypertension (15·3 months, [95% CI: 5·4–‘not applicable’] for RAM + DTIC; 13·5 months [95% CI: 5·1–31·7] for RAM) than that in patients without (7·9 months [95% CI 6·3–12·9] for RAM + DTIC; 11·1 months [95% CI 7·0–13·2] for RAM).


