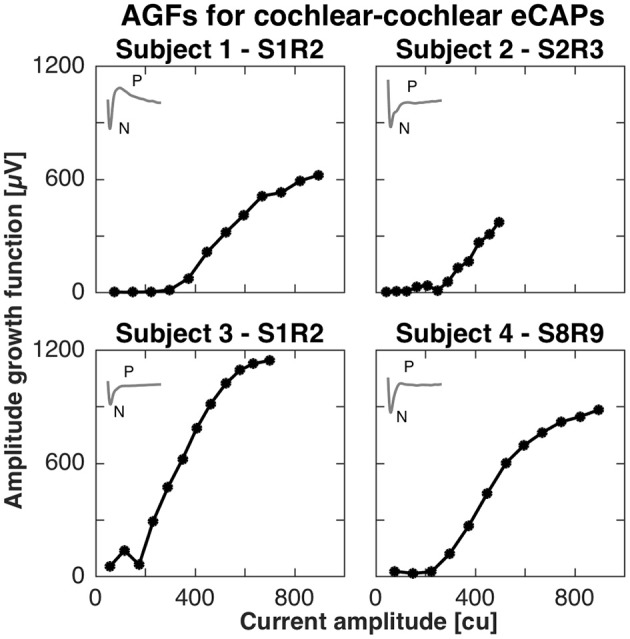
Figure 1.

Amplitude growth functions for the cochlear setup in subjects 1–4. The gray inset in the top left corner of every panel illustrate the eCAP response to the highest current amplitude in that subject. The AGFs were measured for 12 different current amplitudes in each subject and were recorded with apical electrode contacts in subjects 1–3 and basal electrodes for subject 4. A clear N-P complex was best visible in the eCAP response of subject 1, while the slope of the AGF was largest in subject 3 (2.3 μV/cu).
