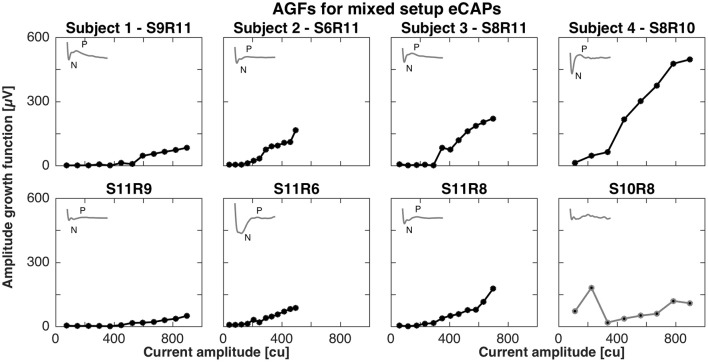
Figure 2.
Amplitude growth functions for the mixed setup in subjects 1–4. The gray insets in the top left corner of each panel represent the eCAP response to the largest current amplitude. eCAPs and AGFs were measured with a stimulating electrode in the cochlea and a recording electrode in a semicircular canal (Top row) and mirrored conditions (Bottom row). A clear N-P complex was only observed in subjects 3 and 4 (S8R11 and S8R10, respectively). Slopes of the AGFs were generally smaller than for the cochlear setup (between 0.1 and 0.8 μV/cu for mixed setup, between 1.0 and 2.3 μV/cu for cochlear setup). S10R8 for subject 4 was grayed out here and in following plots as the eCAP response was not likely to be a neuronal response.

