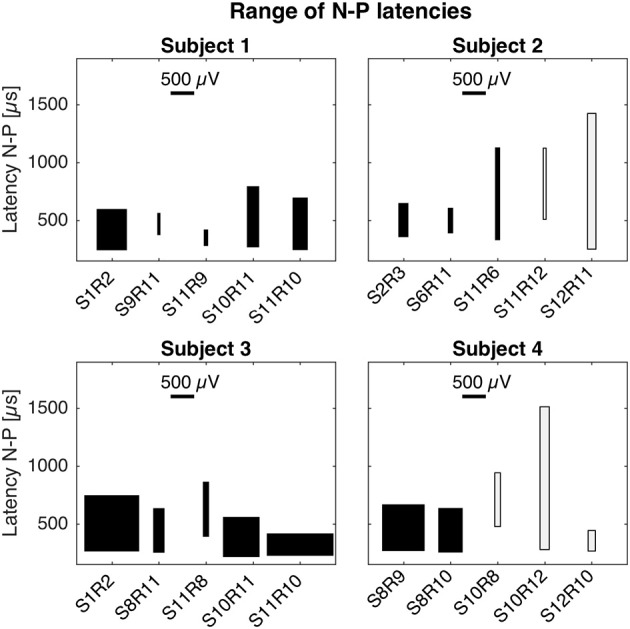
Figure 4.

Magnitudes and latencies of eCAPs in all setups. For a given setup, the box captures the range of N-P magnitudes (width of box) and the range of N-P latencies (height of box). The bottom of the box represents the earliest N peak, while the top of the box represents the latest P peak. These values were taken from the averaged eCAP responses across all current amplitudes (cf. Figures 1–3). Latencies of N-P peaks were comparable across setups and patients. N peaks occurred around 250 μs after stimulation onset and P peaks occurred between 600 and 850 μs. N-P magnitudes denoted by the width of the black boxes were similar for cochlear and trans-canal setups, whereas magnitudes for mixed setup were smaller (cf. subjects 1 and 3). Pairs for subjects 2 and 4 were grayed out as they were likely the result of stimulation artifact.
