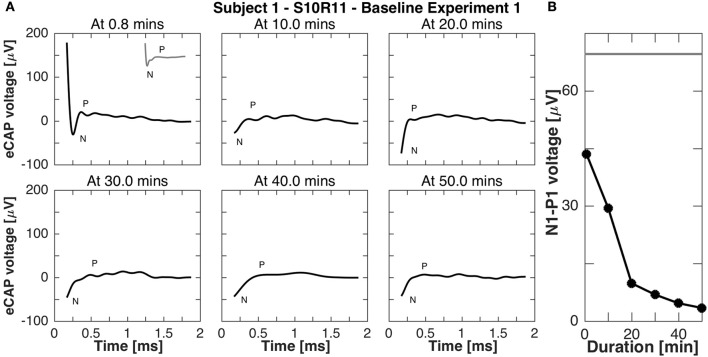
Figure 8.
eCAP responses during continuous stimulation of 50 min in subject 1 (experiment B1). (A) eCAP was recorded at 10 min intervals in response to a pulse with the same current amplitude as the continuous stimulation (but a shorter phase-width, 50 vs. 200 μs, average of 60 iterations). Only at 0.8 min did the eCAP response have a similar morphology to that observed in experiment A without continuous stimulation (gray inset at 0.8 min for comparison). At that time point the N peak was still clearly visible, but for later time points only a part of it was visible. (B) The N-P amplitude measured in this experiment was smaller than that measured experiment A without continuous stimulation at all time points, the eCAP responses here had a smaller N-P amplitude. The gray horizontal line was the N-P magnitude from experiment A for this current amplitude.

