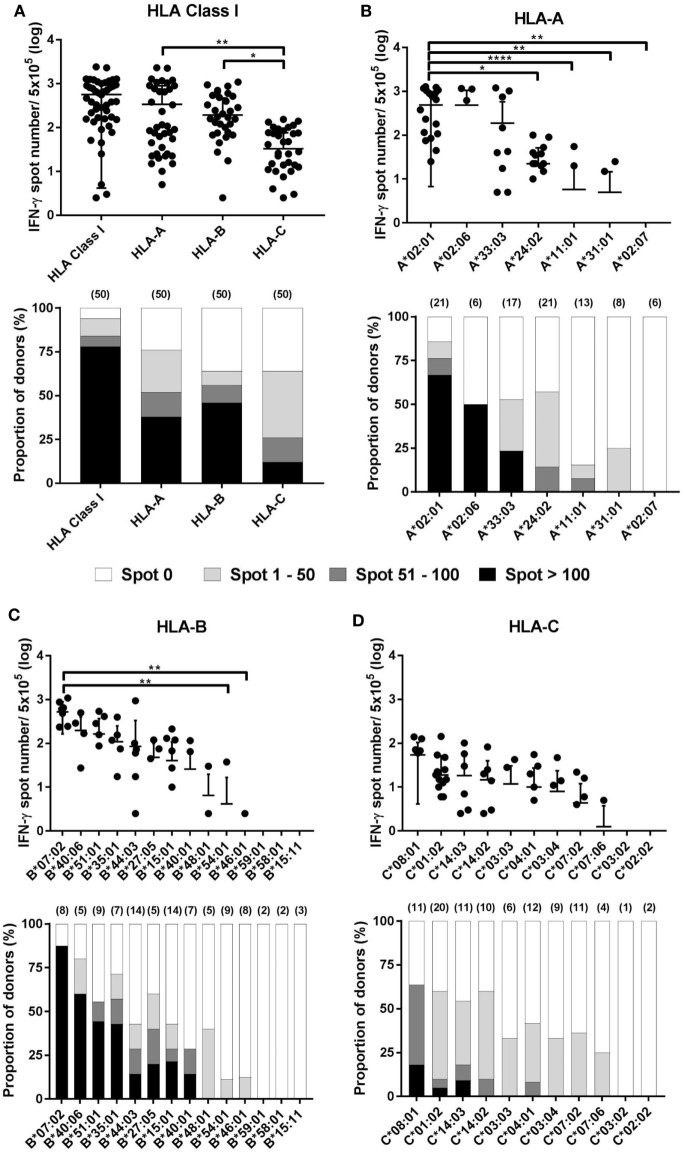
Figure 3.
Distribution of cytomegalovirus (CMV) pp65-specific CD8+ T cells according to individual human leukocyte antigen (HLA) class I loci and allotypes. Distribution of pp65-specific CD8+ T cell responses restricted by total HLA class I, HLA-A, HLA-B, and HLA-C loci (A) and distributions of those by each allotype of the HLA-A (B), HLA-B (C), and HLA-C (D) loci in healthy Korean donors (n = 50). The frequencies of CD8+ T cells by interferon-γ (IFN-γ) enzyme-linked immunospot (ELISPOT) assay (upper). CD8+ T cell frequencies by HLA class I and by HLA-A, -B, or -C loci is the sum of those by the six allotypes present in an individual and the sum of those by the two allotypes present in each locus, respectively. The relative proportion of donors according to the strengths of CD8+ T cell responses (lower). Parenthesis in lower figure indicates the number of donors. P values were calculated by one-way ANOVA (*P < 0.05; **P < 0.01; ***P < 0.001; ****P < 0.0001). Horizontal bars indicate mean and vertical bars indicate SD. Because negative numbers cannot be shown on a logarithmic Y axis, 0 or negative values and some down vertical bars are not displayed.

