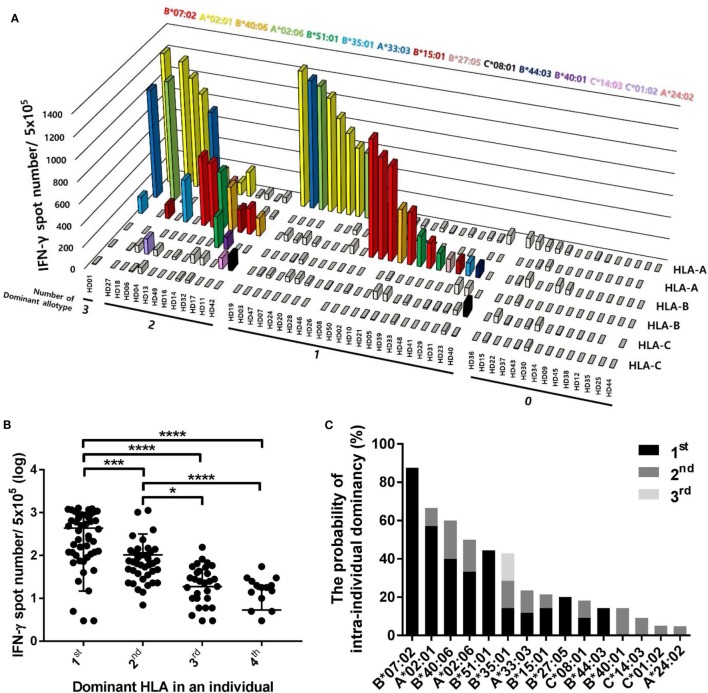
Figure 5.
Distributions of CD8+ T cell responses according to the intraindividual dominance of human leukocyte antigen (HLA) class I allotypes and the probability of intraindividual dominance in each HLA class I allotype. (A) The intraindividual dominant patterns in 50 donors could be classified into four groups by the number of allotypes showing more than 100 interferon-γ (IFN-γ) positive spots per 5 × 10⁵ CD8+ T cells in an individual on the x-axis, the frequencies of pp65 antigen-specific CD8+ T cells by enzyme-linked immunospot (ELISPOT) on the y-axis, and displacing the HLA class I allotypes on the z-axis. (B) When CD8+ T cell responses by each HLA class I allotype in an individual were measured by ELISPOT, the first, second, third, and fourth intraindividual dominance was defined in the order of highest response. The distributions of CD8+ T cell responses in 50 donors were analyzed according to the intraindividual dominance and (C) the probability of intraindividual dominance in each HLA class I allotype was defined in 50 donors with allotypes showing IFN-γ more than 100 positive spots per 5 × 10⁵ CD8+ T cells. P values were calculated by one-way ANOVA (*P < 0.05; **P < 0.01; ***P < 0.001; ****P < 0.0001). Horizontal bars indicate mean and vertical bars indicate SD. Because negative numbers cannot be shown on a logarithmic Y axis, 0 or negative values and some down vertical bars are not displayed.

