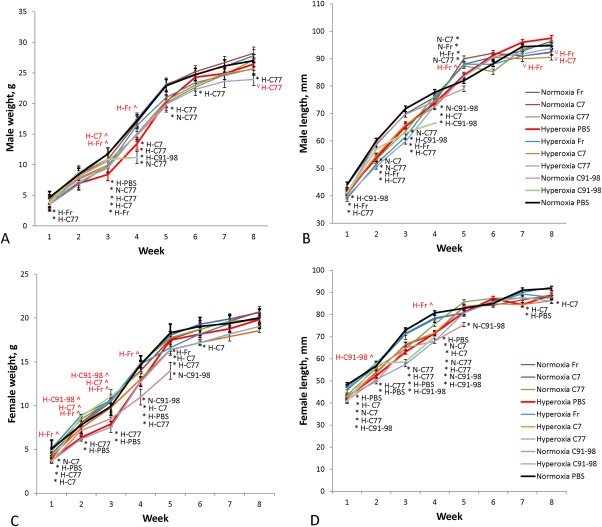
Figure 4.

Mouse weight and length indices. (A): Average male animal weight per group. (B): Average male animal length per group. (C): Average female animal weight per group. (D): Average female animal length per group. Hyperoxia‐C91–98 and normoxia‐C91–98 groups were only observed for the first 4 to 5 weeks, and then sacrificed due to animal distress. Error bars indicate SEM, n = 3–7. Significant differences to control (normoxia‐PBS) at each time point are marked with an asterisk (*) and abbreviated group name in black (e.g., at 3 weeks male animal weight in the hyperoxia‐PBS group was significantly lower than in the normoxia‐PBS control group; p < .05). Significant differences to hyperoxia‐PBS (in hyperoxic groups only) are marked with a circumflex accent (^) in case of increase or letter V (V) in case of decrease and abbreviated group name in red.
