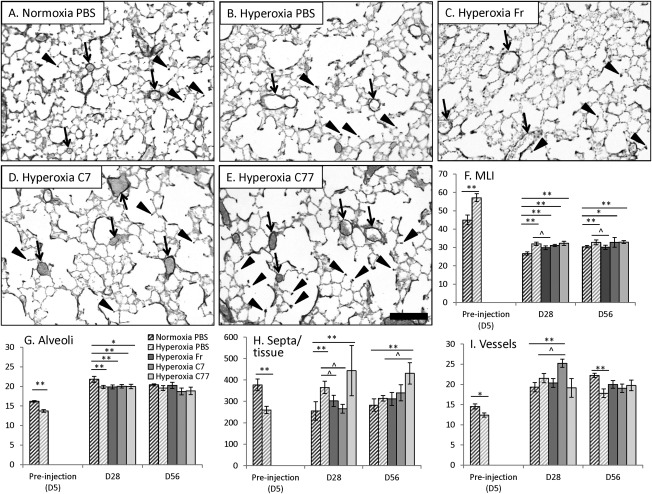
Figure 5.

Morphometric parameters of lung sections. (A–E): Histology of representative mouse lungs from control (A, normoxia‐PBS) and hyperoxic groups (B–E) on D56 (Weigert's elastin staining, elastin—black). Example blood vessels are labeled with arrows, example secondary septa are labeled with arrowheads. Scale bar = 100 μm. (F–I): Statistical analysis of morphometric parameters of the lung in hyperoxic groups injected with cells (fresh or cultured for 7 or 77 days) in comparison to normoxia‐PBS and hyperoxia‐PBS. (F): Alveolar size based on MLI (in µm), (G) Number of alveoli was counted per 3.63 mm line, in airspaces per 1 mm, (H) Number of secondary septa per 1 mm2 of lung tissue area, (I) Number of elastin‐positive blood vessels per 0.564 mm2 of lung image. Significant differences to respective normoxic controls (dark upward diagonal lines) are marked with two asterisks (**, p < .01, n = 4–5) or one asterisk (*, p < .05, n = 4–5). Significant differences to respective hyperoxic controls (light upward diagonal lines) are marked with circumflex accent (^, p < .05, n = 4–5). Abbreviations: MLI, mean linear intercept; PBS, phosphate buffered saline.
