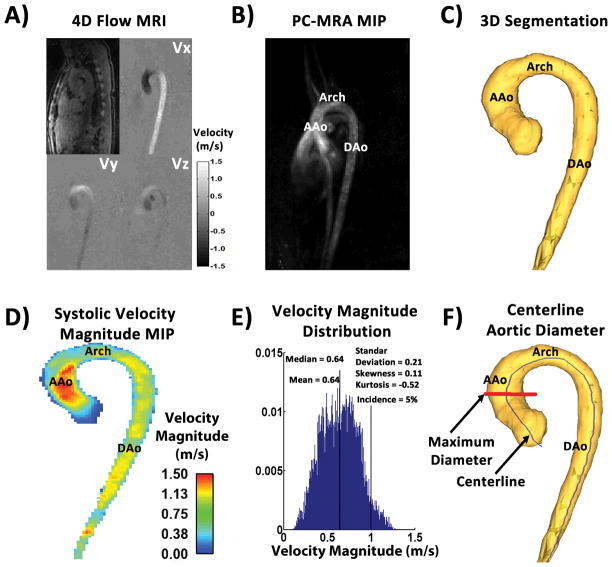
FIGURE 1. Workflow for velocity magnitude distribution analysis.
Panel A shows an example of 4D flow MRI dataset after pre-processing. Panel B shows the maximum intensity projection in the sagittal plane of the 3D PC-MRA calculated from the panel A dataset. Panel C illustrates the aorta segmentation of the 3D PC-MRA. Panel D shows the systolic velocity magnitude MIP in the sagittal plane of masked velocities. Panel E shows the corresponding velocity magnitude histogram within the aortic segmentation. Panel F shows an example of maximum mid-ascending aortic diameter (in red) calculation derived from the centerline (in blue). MIP: Maximum intensity projection. PC-MRA: phase-contrast MR angiogram. AAo: Ascending aorta. DAo: Descending aorta.

